Data
29,910 items of data are available, covering 29,573 participants.
Defined-instances run from 2 to 3, labelled using Instancing
2.
Units of measurement are %.
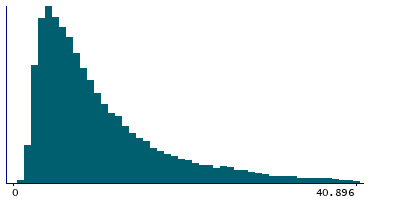
| Maximum | 54.6645 |
| Decile 9 | 22.0867 |
| Decile 8 | 15.6001 |
| Decile 7 | 12.1659 |
| Decile 6 | 9.77785 |
| Median | 8.0402 |
| Decile 4 | 6.63955 |
| Decile 3 | 5.44281 |
| Decile 2 | 4.33976 |
| Decile 1 | 3.26304 |
| Minimum | 0.796296 |
|
|
- Mean = 10.6355
- Std.dev = 8.16411
- 229 items above graph maximum of 40.9104
|
2 Instances
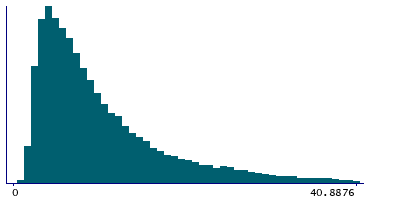
Instance 2 : Imaging visit (2014+)
29,430 participants, 29,430 items
| Maximum | 53.9811 |
| Decile 9 | 22.0806 |
| Decile 8 | 15.6037 |
| Decile 7 | 12.1753 |
| Decile 6 | 9.7946 |
| Median | 8.04909 |
| Decile 4 | 6.64995 |
| Decile 3 | 5.44606 |
| Decile 2 | 4.34001 |
| Decile 1 | 3.26302 |
| Minimum | 0.796296 |
|
|
- Mean = 10.6408
- Std.dev = 8.16233
- 225 items above graph maximum of 40.8982
|
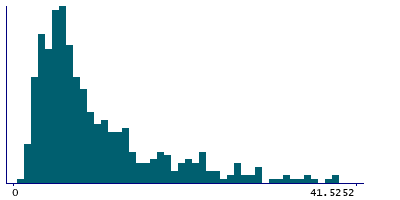
Instance 3 : First repeat imaging visit (2019+)
480 participants, 480 items
| Maximum | 54.6645 |
| Decile 9 | 22.4177 |
| Decile 8 | 14.9043 |
| Decile 7 | 11.5579 |
| Decile 6 | 8.90165 |
| Median | 7.37068 |
| Decile 4 | 6.15726 |
| Decile 3 | 5.32507 |
| Decile 2 | 4.32817 |
| Decile 1 | 3.31024 |
| Minimum | 1.44955 |
|
|
- Mean = 10.3079
- Std.dev = 8.26603
- 4 items above graph maximum of 41.5252
|
Notes
Pancreas fat fraction
0 Related Data-Fields
There are no related data-fields
0 Resources
There are no matching Resources
