Data
643,191 items of data are available, covering 501,081 participants.
Some values have special meanings defined by Data-Coding
100373.
Defined-instances run from 0 to 3, labelled using Instancing
2.
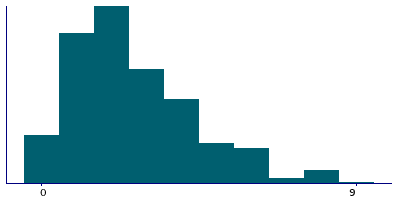
Units of measurement are glasses/day.
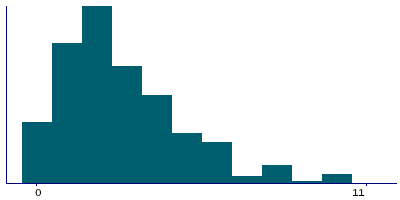
| Maximum | 80 |
| Decile 9 | 6 |
| Decile 8 | 4 |
| Decile 7 | 4 |
| Decile 6 | 3 |
| Median | 2 |
| Decile 4 | 2 |
| Decile 3 | 2 |
| Decile 2 | 1 |
| Decile 1 | 1 |
| Minimum | 0 |
|
|
- There are 44 distinct values.
- Mean = 2.8669
- Std.dev = 2.21512
- 2209 items above graph maximum of 11
- 42909 items have value -10 (Less than one)
- 312 items have value -3 (Prefer not to answer)
- 4181 items have value -1 (Do not know)
|
4 Instances
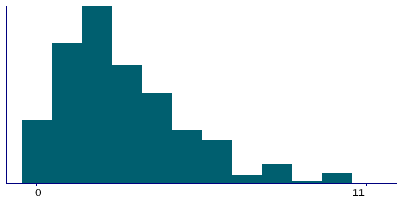
Instance 0 : Initial assessment visit (2006-2010) at which participants were recruited and consent given
501,040 participants, 501,040 items
| Maximum | 80 |
| Decile 9 | 6 |
| Decile 8 | 4 |
| Decile 7 | 4 |
| Decile 6 | 3 |
| Median | 2 |
| Decile 4 | 2 |
| Decile 3 | 2 |
| Decile 2 | 1 |
| Decile 1 | 1 |
| Minimum | 0 |
|
|
- There are 43 distinct values.
- Mean = 2.89223
- Std.dev = 2.25827
- 1886 items above graph maximum of 11
- 33329 items have value -10 (Less than one)
- 279 items have value -3 (Prefer not to answer)
- 3601 items have value -1 (Do not know)
|
Instance 1 : First repeat assessment visit (2012-13)
20,314 participants, 20,314 items
| Maximum | 20 |
| Decile 9 | 5 |
| Decile 8 | 4 |
| Decile 7 | 3 |
| Decile 6 | 2 |
| Median | 2 |
| Decile 4 | 2 |
| Decile 3 | 1 |
| Decile 2 | 1 |
| Decile 1 | 0 |
| Minimum | 0 |
|
|
- There are 18 distinct values.
- Mean = 2.34809
- Std.dev = 1.89904
- 26 items above graph maximum of 10
- 1965 items have value -10 (Less than one)
- 3 items have value -3 (Prefer not to answer)
- 66 items have value -1 (Do not know)
|
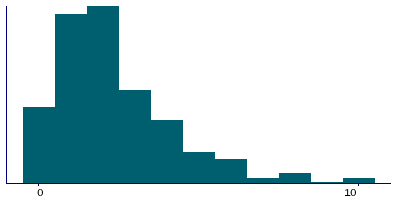
Instance 2 : Imaging visit (2014+)
100,917 participants, 100,917 items
| Maximum | 49 |
| Decile 9 | 6 |
| Decile 8 | 4 |
| Decile 7 | 4 |
| Decile 6 | 3 |
| Median | 2 |
| Decile 4 | 2 |
| Decile 3 | 2 |
| Decile 2 | 1 |
| Decile 1 | 1 |
| Minimum | 0 |
|
|
- There are 25 distinct values.
- Mean = 2.87218
- Std.dev = 2.07669
- 256 items above graph maximum of 11
- 6188 items have value -10 (Less than one)
- 27 items have value -3 (Prefer not to answer)
- 429 items have value -1 (Do not know)
|
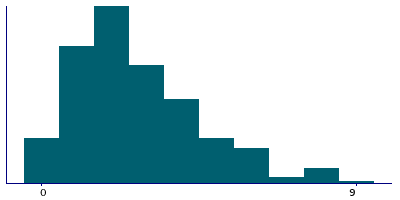
Instance 3 : First repeat imaging visit (2019+)
20,920 participants, 20,920 items
| Maximum | 32 |
| Decile 9 | 5 |
| Decile 8 | 4 |
| Decile 7 | 3 |
| Decile 6 | 3 |
| Median | 2 |
| Decile 4 | 2 |
| Decile 3 | 2 |
| Decile 2 | 1 |
| Decile 1 | 1 |
| Minimum | 0 |
|
|
- There are 22 distinct values.
- Mean = 2.7245
- Std.dev = 2.02854
- 202 items above graph maximum of 9
- 1427 items have value -10 (Less than one)
- 3 items have value -3 (Prefer not to answer)
- 85 items have value -1 (Do not know)
|
Notes
ACE touchscreen question "How many glasses of water do you drink each DAY? "
The following checks were performed:
- If answer < 0 then rejected
- If answer > 99 then rejected
- If answer > 10 then participant asked to confirm
If the participant activated the Help button they were shown the message:
Please provide an average considering your intake over the last year.
If you are unsure, please provide an estimate or select Do not know.
|
Coding 100373 defines 3 special values:
- -10 represents "Less than one"
- -1 represents "Do not know"
- -3 represents "Prefer not to answer"
0 Related Data-Fields
There are no related data-fields
9 Applications
| Application ID | Title |
|---|
| 5974 | Development and validation of risk prediction models for cancer. |
| 23183 | Dietary iron intake and public health risk |
| 14935 | Electronic Longitudinal Alcohol Study in Communities (ELAStiC) |
| 48818 | Evaluate the causal effects of diet-modifiable biomarkers on clinical outcomes using Mendelian randomization |
| 29009 | Food consumption (coffee, dairy products and soft drinks), Mediterranean dietary pattern and risk of falls or hearing loss in the elderly. |
| 24494 | Mediating mechanisms linking anthropometric, lifestyle and dietary risk factors with cancer risk |
| 20175 | Nutrition, diet and health: examining causal associations and gene-environment interactions |
| 15008 | The impact of smoking, alcohol and adiposity on health outcomes in the UK Biobank |
| 20684 | Understanding the associations between environmental exposures, health behaviours and health outcomes |


