Data
642,962 items of data are available, covering 500,887 participants.
Some values have special meanings defined by Data-Coding
100329.
Defined-instances run from 0 to 3, labelled using Instancing
2.
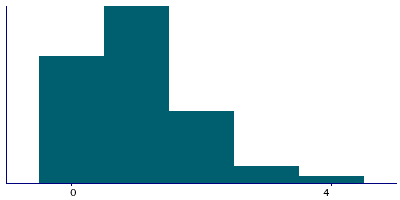
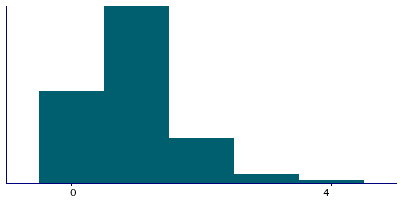
Units of measurement are hours/day.
| Maximum | 24 |
| Decile 9 | 2 |
| Decile 8 | 2 |
| Decile 7 | 1 |
| Decile 6 | 1 |
| Median | 1 |
| Decile 4 | 1 |
| Decile 3 | 0 |
| Decile 2 | 0 |
| Decile 1 | 0 |
| Minimum | 0 |
|
|
- There are 22 distinct values.
- Mean = 1.16314
- Std.dev = 1.36661
- 11664 items above graph maximum of 4
- 212384 items have value -10 (Less than an hour a day)
- 2718 items have value -3 (Prefer not to answer)
- 7511 items have value -1 (Do not know)
|
4 Instances
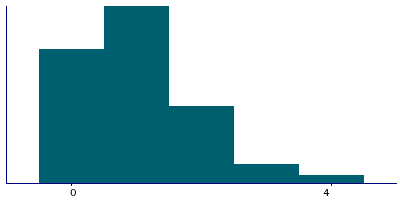
Instance 0 : Initial assessment visit (2006-2010) at which participants were recruited and consent given
500,811 participants, 500,811 items
| Maximum | 24 |
| Decile 9 | 2 |
| Decile 8 | 2 |
| Decile 7 | 1 |
| Decile 6 | 1 |
| Median | 1 |
| Decile 4 | 1 |
| Decile 3 | 0 |
| Decile 2 | 0 |
| Decile 1 | 0 |
| Minimum | 0 |
|
|
- There are 22 distinct values.
- Mean = 1.19483
- Std.dev = 1.42385
- 10437 items above graph maximum of 4
- 153504 items have value -10 (Less than an hour a day)
- 2470 items have value -3 (Prefer not to answer)
- 6331 items have value -1 (Do not know)
|
Instance 1 : First repeat assessment visit (2012-13)
20,314 participants, 20,314 items
| Maximum | 11 |
| Decile 9 | 2 |
| Decile 8 | 2 |
| Decile 7 | 1 |
| Decile 6 | 1 |
| Median | 1 |
| Decile 4 | 1 |
| Decile 3 | 1 |
| Decile 2 | 0 |
| Decile 1 | 0 |
| Minimum | 0 |
|
|
- There are 12 distinct values.
- Mean = 1.14261
- Std.dev = 1.12358
- 206 items above graph maximum of 4
- 8216 items have value -10 (Less than an hour a day)
- 36 items have value -3 (Prefer not to answer)
- 155 items have value -1 (Do not know)
|
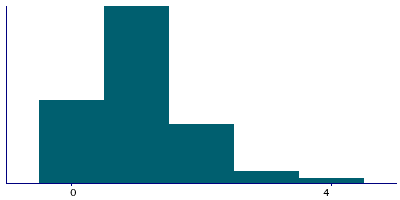
Instance 2 : Imaging visit (2014+)
100,917 participants, 100,917 items
| Maximum | 20 |
| Decile 9 | 2 |
| Decile 8 | 1 |
| Decile 7 | 1 |
| Decile 6 | 1 |
| Median | 1 |
| Decile 4 | 1 |
| Decile 3 | 1 |
| Decile 2 | 0 |
| Decile 1 | 0 |
| Minimum | 0 |
|
|
- There are 18 distinct values.
- Mean = 1.01824
- Std.dev = 1.10067
- 877 items above graph maximum of 4
- 41760 items have value -10 (Less than an hour a day)
- 179 items have value -3 (Prefer not to answer)
- 876 items have value -1 (Do not know)
|
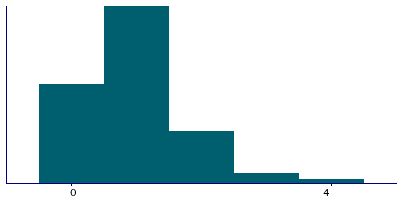
Instance 3 : First repeat imaging visit (2019+)
20,920 participants, 20,920 items
| Maximum | 12 |
| Decile 9 | 2 |
| Decile 8 | 1 |
| Decile 7 | 1 |
| Decile 6 | 1 |
| Median | 1 |
| Decile 4 | 1 |
| Decile 3 | 1 |
| Decile 2 | 0 |
| Decile 1 | 0 |
| Minimum | 0 |
|
|
- There are 13 distinct values.
- Mean = 0.988677
- Std.dev = 0.983061
- 144 items above graph maximum of 4
- 8904 items have value -10 (Less than an hour a day)
- 33 items have value -3 (Prefer not to answer)
- 149 items have value -1 (Do not know)
|
Notes
ACE touchscreen question "In a typical DAY, how many hours do you spend driving?"
The following checks were performed:
- If answer < 0 then rejected
- If answer > 24 then rejected
- If answer > 6 then participant asked to confirm
If the participant activated the Help button they were shown the message:
If the time you spend driving varies a lot, give the average time
for a 24 hour day in the last 4 weeks.
Include driving a car, bus, motorcycle, boat, truck etc.
Include all the driving that you do as part of work, getting to work
or outside of work.
If you do not drive please enter 0.
|
Coding 100329 defines 3 special values:
- -10 represents "Less than an hour a day"
- -1 represents "Do not know"
- -3 represents "Prefer not to answer"
0 Related Data-Fields
There are no related data-fields
2 Applications
| Application ID | Title |
|---|
| 3173 | A multi-level approach to better understand the association between physical activity and sedentary behaviour, and cancer risk. |
| 4483 | Identification of modifiable and non-modifiable correlates of sedentary behaviours and physical activity in adults aged =65 years |


