Data
614,443 items of data are available, covering 501,322 participants.
Some values have special meanings defined by Data-Coding
100307.
Defined-instances run from 0 to 3, labelled using Instancing
2.
Units of measurement are days/week.
| Maximum | 7 |
| Decile 9 | 7 |
| Decile 8 | 7 |
| Decile 7 | 7 |
| Decile 6 | 7 |
| Median | 6 |
| Decile 4 | 5 |
| Decile 3 | 5 |
| Decile 2 | 4 |
| Decile 1 | 2 |
| Minimum | 0 |
|
|
- There are 8 distinct values.
- Mean = 5.44399
- Std.dev = 1.90333
- 1015 items have value -3 (Prefer not to answer)
- 2078 items have value -2 (Unable to walk)
- 7322 items have value -1 (Do not know)
|
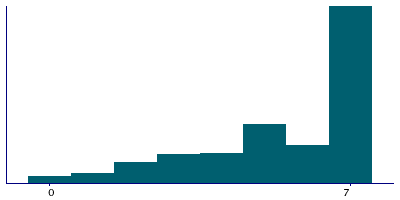
4 Instances
Instance 0 : Initial assessment visit (2006-2010) at which participants were recruited and consent given
501,291 participants, 501,291 items
| Maximum | 7 |
| Decile 9 | 7 |
| Decile 8 | 7 |
| Decile 7 | 7 |
| Decile 6 | 7 |
| Median | 6 |
| Decile 4 | 5 |
| Decile 3 | 5 |
| Decile 2 | 4 |
| Decile 1 | 2 |
| Minimum | 0 |
|
|
- There are 8 distinct values.
- Mean = 5.39087
- Std.dev = 1.93111
- 976 items have value -3 (Prefer not to answer)
- 1928 items have value -2 (Unable to walk)
- 6682 items have value -1 (Do not know)
|
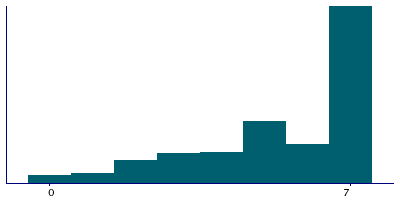
Instance 1 : First repeat assessment visit (2012-13)
20,328 participants, 20,328 items
| Maximum | 7 |
| Decile 9 | 7 |
| Decile 8 | 7 |
| Decile 7 | 7 |
| Decile 6 | 7 |
| Median | 6 |
| Decile 4 | 5 |
| Decile 3 | 4 |
| Decile 2 | 3 |
| Decile 1 | 2 |
| Minimum | 0 |
|
|
- There are 8 distinct values.
- Mean = 5.22956
- Std.dev = 1.97082
- 9 items have value -3 (Prefer not to answer)
- 58 items have value -2 (Unable to walk)
- 140 items have value -1 (Do not know)
|
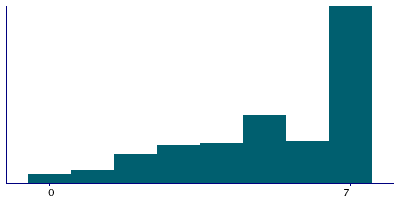
Instance 2 : Imaging visit (2014+)
84,020 participants, 84,020 items
| Maximum | 7 |
| Decile 9 | 7 |
| Decile 8 | 7 |
| Decile 7 | 7 |
| Decile 6 | 7 |
| Median | 7 |
| Decile 4 | 6 |
| Decile 3 | 5 |
| Decile 2 | 4 |
| Decile 1 | 3 |
| Minimum | 0 |
|
|
- There are 8 distinct values.
- Mean = 5.76292
- Std.dev = 1.69923
- 29 items have value -3 (Prefer not to answer)
- 90 items have value -2 (Unable to walk)
- 477 items have value -1 (Do not know)
|
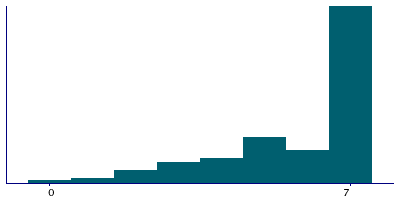
Instance 3 : First repeat imaging visit (2019+)
8,804 participants, 8,804 items
| Maximum | 7 |
| Decile 9 | 7 |
| Decile 8 | 7 |
| Decile 7 | 7 |
| Decile 6 | 7 |
| Median | 7 |
| Decile 4 | 6 |
| Decile 3 | 5 |
| Decile 2 | 5 |
| Decile 1 | 3 |
| Minimum | 0 |
|

|
- There are 8 distinct values.
- Mean = 5.88027
- Std.dev = 1.61951
- 1 items have value -3 (Prefer not to answer)
- 2 items have value -2 (Unable to walk)
- 23 items have value -1 (Do not know)
|
Notes
ACE touchscreen question "In a typical WEEK, on how many days did you walk for at least 10 minutes at a time? (Include walking that you do at work, travelling to and from work, and for sport or leisure)"
The following checks were performed:
- If answer < 0 then rejected
- If answer > 7 then rejected
If the participant activated the Help button they were shown the message:
Count the number of days in a week that you walk for at least 10 minutes
continuously at a time.
|
Coding 100307 defines 3 special values:
- -1 represents "Do not know"
- -2 represents "Unable to walk"
- -3 represents "Prefer not to answer"
4 Related Data-Fields
| Field ID | Description | Relationship |
|---|
| 874 | Duration of walks | Field 874 was collected from participants who indicated that they walked for 10 minutes on at least 1 day per week in the previous 4 weeks, as defined by their answers to Current Field |
| 943 | Frequency of stair climbing in last ... | Field 943 was collected from all participants except those who indicated they were unable to walk, as defined by their answers to Current Field |
| 6162 | Types of transport used (excluding work) | Field 6162 was collected from all participants except those who indicated they were unable to walk, as defined by their answers to Current Field |
| 924 | Usual walking pace | Field 924 was collected from all participants except those who indicated they were unable to walk, as defined by their answers to Current Field |


