Data
1,842,210 items of data are available, covering 67,198 participants.
Defined-instances run from 2 to 3, labelled using Instancing
2.
Array indices run from 0 to 29.
Units of measurement are milliseconds.
| Maximum | 26692 |
| Decile 9 | 9688 |
| Decile 8 | 6755 |
| Decile 7 | 5179 |
| Decile 6 | 4134 |
| Median | 3370 |
| Decile 4 | 2766 |
| Decile 3 | 2265 |
| Decile 2 | 1825 |
| Decile 1 | 1389 |
| Minimum | 0 |
|

|
- There are 6109 distinct values.
- Mean = 4667.9
- Std.dev = 3937.34
- 30744 items above graph maximum of 17987
|
2 Instances
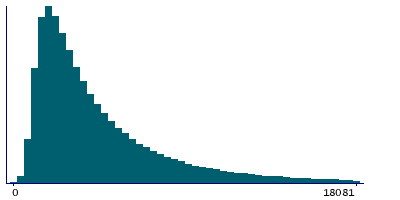
Instance 2 : Imaging visit (2014+)
65,789 participants, 1,633,125 items
| Maximum | 26625 |
| Decile 9 | 9735 |
| Decile 8 | 6782 |
| Decile 7 | 5203 |
| Decile 6 | 4150 |
| Median | 3385 |
| Decile 4 | 2777 |
| Decile 3 | 2277 |
| Decile 2 | 1828 |
| Decile 1 | 1389 |
| Minimum | 0 |
|
|
- There are 6100 distinct values.
- Mean = 4685.57
- Std.dev = 3954.81
- 27197 items above graph maximum of 18081
|
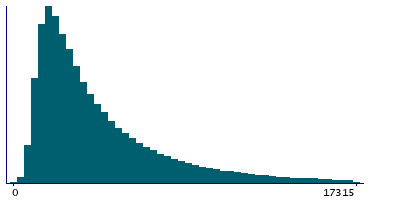
Instance 3 : First repeat imaging visit (2019+)
8,395 participants, 209,085 items
| Maximum | 26692 |
| Decile 9 | 9344 |
| Decile 8 | 6547 |
| Decile 7 | 5038 |
| Decile 6 | 4026 |
| Median | 3276 |
| Decile 4 | 2699 |
| Decile 3 | 2215 |
| Decile 2 | 1794 |
| Decile 1 | 1373 |
| Minimum | 0 |
|
|
- There are 5197 distinct values.
- Mean = 4529.84
- Std.dev = 3795.26
- 3474 items above graph maximum of 17315
|


