Data
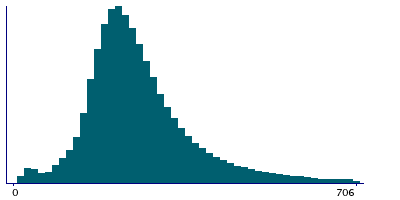
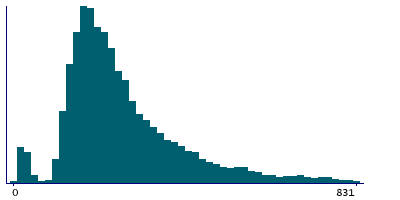
613,846 items of data are available, covering 501,008 participants.
Defined-instances run from 0 to 3, labelled using Instancing
2.
Units of measurement are seconds.
| Maximum | 11877 |
| Decile 9 | 428 |
| Decile 8 | 338 |
| Decile 7 | 294 |
| Decile 6 | 264 |
| Median | 241 |
| Decile 4 | 220 |
| Decile 3 | 201 |
| Decile 2 | 179 |
| Decile 1 | 150 |
| Minimum | 7 |
|
|
- There are 1931 distinct values.
- Mean = 274.673
- Std.dev = 157.969
- 14183 items above graph maximum of 706
|
4 Instances
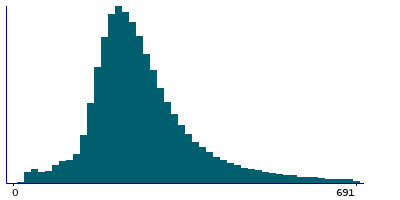
Instance 0 : Initial assessment visit (2006-2010) at which participants were recruited and consent given
500,953 participants, 500,953 items
| Maximum | 11877 |
| Decile 9 | 424 |
| Decile 8 | 336 |
| Decile 7 | 294 |
| Decile 6 | 265 |
| Median | 243 |
| Decile 4 | 223 |
| Decile 3 | 204 |
| Decile 2 | 185 |
| Decile 1 | 157 |
| Minimum | 14 |
|
|
- There are 1904 distinct values.
- Mean = 276.874
- Std.dev = 157.775
- 12480 items above graph maximum of 691
|
Instance 1 : First repeat assessment visit (2012-13)
20,328 participants, 20,328 items
| Maximum | 2016 |
| Decile 9 | 416 |
| Decile 8 | 328 |
| Decile 7 | 284.5 |
| Decile 6 | 256 |
| Median | 236 |
| Decile 4 | 220 |
| Decile 3 | 204 |
| Decile 2 | 186 |
| Decile 1 | 160 |
| Minimum | 15 |
|
|
- There are 969 distinct values.
- Mean = 270.979
- Std.dev = 146.862
- 506 items above graph maximum of 672
|
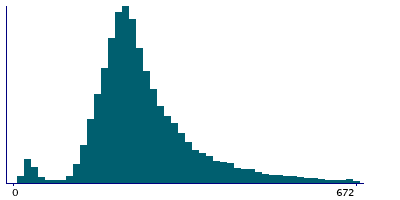
Instance 2 : Imaging visit (2014+)
83,754 participants, 83,754 items
| Maximum | 5264 |
| Decile 9 | 445 |
| Decile 8 | 353 |
| Decile 7 | 297 |
| Decile 6 | 257 |
| Median | 224 |
| Decile 4 | 196 |
| Decile 3 | 172 |
| Decile 2 | 151 |
| Decile 1 | 124 |
| Minimum | 7 |
|
|
- There are 1246 distinct values.
- Mean = 262.27
- Std.dev = 159.801
- 1307 items above graph maximum of 766
|
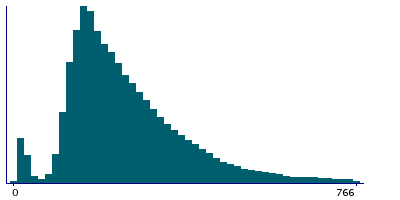
Instance 3 : First repeat imaging visit (2019+)
8,811 participants, 8,811 items
| Maximum | 2319 |
| Decile 9 | 480 |
| Decile 8 | 364 |
| Decile 7 | 300.5 |
| Decile 6 | 260 |
| Median | 230 |
| Decile 4 | 206 |
| Decile 3 | 183 |
| Decile 2 | 162 |
| Decile 1 | 135 |
| Minimum | 7 |
|
|
- There are 846 distinct values.
- Mean = 275.924
- Std.dev = 170.126
- 152 items above graph maximum of 825
|
Notes
Time taken for participant to complete the blood phlebotomy station of the Assessment Centre visit. This is longer than the time during which they were actively giving blood.
0 Related Data-Fields
There are no related data-fields
0 Resources
There are no matching Resources
