Data
612,090 items of data are available, covering 500,107 participants.
Defined-instances run from 0 to 3, labelled using Instancing
2.
Units of measurement are cm.
| Maximum | 197 |
| Decile 9 | 107 |
| Decile 8 | 101 |
| Decile 7 | 97 |
| Decile 6 | 93 |
| Median | 90 |
| Decile 4 | 86 |
| Decile 3 | 83 |
| Decile 2 | 78 |
| Decile 1 | 73 |
| Minimum | 20 |
|
|
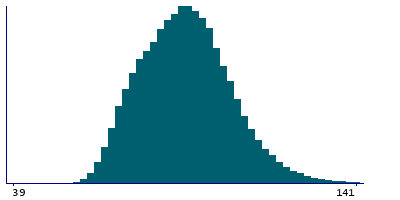
- Mean = 90.2216
- Std.dev = 13.3995
- 6 items below graph minimum of 39
- 689 items above graph maximum of 141
|
4 Instances
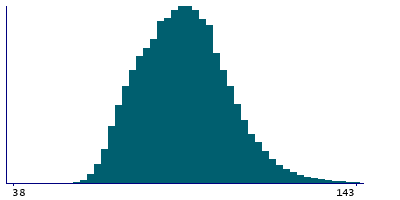
Instance 0 : Initial assessment visit (2006-2010) at which participants were recruited and consent given
500,005 participants, 500,005 items
| Maximum | 197 |
| Decile 9 | 108 |
| Decile 8 | 101 |
| Decile 7 | 97 |
| Decile 6 | 93 |
| Median | 90 |
| Decile 4 | 86 |
| Decile 3 | 83 |
| Decile 2 | 78 |
| Decile 1 | 73 |
| Minimum | 20 |
|
|
- Mean = 90.3126
- Std.dev = 13.4859
- 4 items below graph minimum of 38
- 453 items above graph maximum of 143
|
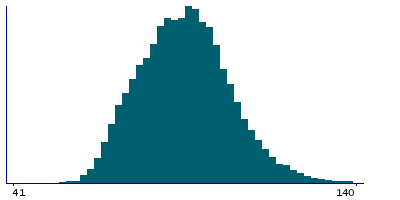
Instance 1 : First repeat assessment visit (2012-13)
20,314 participants, 20,314 items
| Maximum | 164 |
| Decile 9 | 107 |
| Decile 8 | 101 |
| Decile 7 | 97 |
| Decile 6 | 93 |
| Median | 90 |
| Decile 4 | 87 |
| Decile 3 | 83 |
| Decile 2 | 79 |
| Decile 1 | 74 |
| Minimum | 26 |
|
|
- Mean = 90.5642
- Std.dev = 13.2324
- 2 items below graph minimum of 41
- 31 items above graph maximum of 140
|
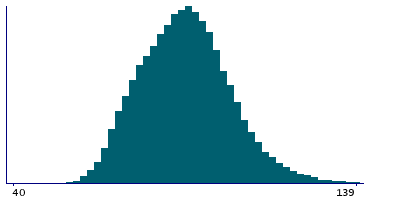
Instance 2 : Imaging visit (2014+)
82,991 participants, 82,991 items
| Maximum | 184 |
| Decile 9 | 106 |
| Decile 8 | 100 |
| Decile 7 | 96 |
| Decile 6 | 92 |
| Median | 89 |
| Decile 4 | 86 |
| Decile 3 | 82 |
| Decile 2 | 78 |
| Decile 1 | 73 |
| Minimum | 20 |
|
|
- Mean = 89.6428
- Std.dev = 12.9831
- 1 item below graph minimum of 40
- 83 items above graph maximum of 139
|
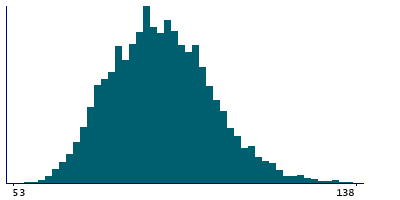
Instance 3 : First repeat imaging visit (2019+)
8,780 participants, 8,780 items
| Maximum | 153 |
| Decile 9 | 106 |
| Decile 8 | 100 |
| Decile 7 | 96 |
| Decile 6 | 92 |
| Median | 89 |
| Decile 4 | 86 |
| Decile 3 | 83 |
| Decile 2 | 79 |
| Decile 1 | 74 |
| Minimum | 53 |
|
|
- Mean = 89.7158
- Std.dev = 12.5354
- 5 items above graph maximum of 138
|

