Data
933 items of data are available, covering 932 participants.
Defined-instances run from 0 to 3, labelled using Instancing
2.
Units of measurement are m/s.
| Maximum | 50 |
| Decile 9 | 13.26 |
| Decile 8 | 11.945 |
| Decile 7 | 11 |
| Decile 6 | 10.31 |
| Median | 9.51 |
| Decile 4 | 8.66 |
| Decile 3 | 7.83 |
| Decile 2 | 6.985 |
| Decile 1 | 6.12 |
| Minimum | 1.89 |
|
|
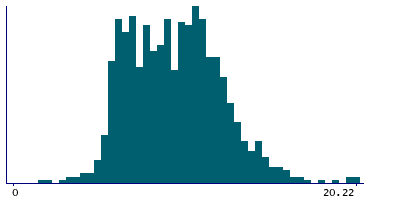
- Mean = 10.0612
- Std.dev = 5.11861
- 15 items above graph maximum of 20.4
|
4 Instances
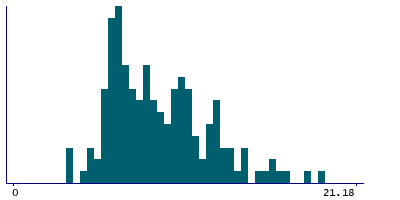
Instance 0 : Initial assessment visit (2006-2010) at which participants were recruited and consent given
161 participants, 161 items
| Maximum | 49 |
| Decile 9 | 13.515 |
| Decile 8 | 12.09 |
| Decile 7 | 10.56 |
| Decile 6 | 9.615 |
| Median | 8.495 |
| Decile 4 | 7.71 |
| Decile 3 | 6.835 |
| Decile 2 | 6.385 |
| Decile 1 | 5.85 |
| Minimum | 3.45 |
|
|
- Mean = 9.84578
- Std.dev = 6.25428
- 4 items above graph maximum of 21.18
|
Instance 1 : First repeat assessment visit (2012-13)
7 participants, 7 items
Too few values for statistical summary.
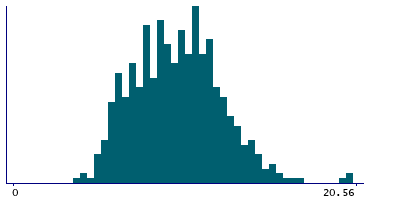
Instance 2 : Imaging visit (2014+)
532 participants, 532 items
| Maximum | 50 |
| Decile 9 | 13.46 |
| Decile 8 | 12 |
| Decile 7 | 11.29 |
| Decile 6 | 10.64 |
| Median | 9.89 |
| Decile 4 | 9 |
| Decile 3 | 8.22 |
| Decile 2 | 7.415 |
| Decile 1 | 6.36 |
| Minimum | 1.89 |
|
|
- Mean = 10.4591
- Std.dev = 5.52071
- 11 items above graph maximum of 20.56
|
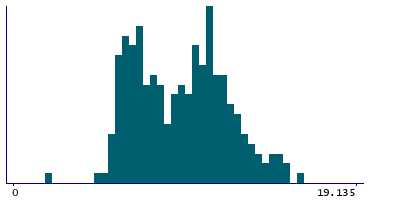
Instance 3 : First repeat imaging visit (2019+)
233 participants, 233 items
| Maximum | 20 |
| Decile 9 | 12.635 |
| Decile 8 | 11.635 |
| Decile 7 | 11 |
| Decile 6 | 10.265 |
| Median | 9.385 |
| Decile 4 | 8.215 |
| Decile 3 | 7.35 |
| Decile 2 | 6.785 |
| Decile 1 | 6.135 |
| Minimum | 1.98 |
|
|
- Mean = 9.36395
- Std.dev = 2.62952
- 1 item above graph maximum of 19.135
|


