Data
3,632,878 items of data are available, covering 494,275 participants.
Defined-instances run from 0 to 3, labelled using Instancing
2.
Array indices run from 0 to 11.
Units of measurement are milliseconds.
| Maximum | 121281 |
| Decile 9 | 766 |
| Decile 8 | 671 |
| Decile 7 | 610 |
| Decile 6 | 578 |
| Median | 547 |
| Decile 4 | 516 |
| Decile 3 | 485 |
| Decile 2 | 453 |
| Decile 1 | 422 |
| Minimum | 0 |
|

|
- There are 785 distinct values.
- Mean = 580.403
- Std.dev = 192.02
- 58862 items above graph maximum of 1110
|
4 Instances
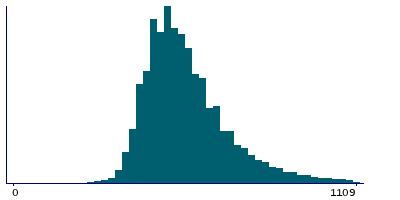
Instance 0 : Initial assessment visit (2006-2010) at which participants were recruited and consent given
492,915 participants, 2,986,177 items
| Maximum | 121281 |
| Decile 9 | 765 |
| Decile 8 | 657 |
| Decile 7 | 609 |
| Decile 6 | 563 |
| Median | 532 |
| Decile 4 | 515 |
| Decile 3 | 484 |
| Decile 2 | 453 |
| Decile 1 | 421 |
| Minimum | 0 |
|
|
- There are 473 distinct values.
- Mean = 574.104
- Std.dev = 194.736
- 49521 items above graph maximum of 1109
|
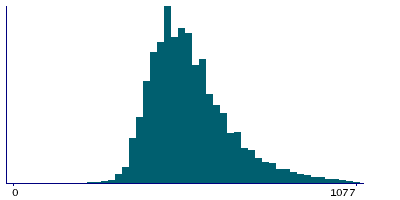
Instance 1 : First repeat assessment visit (2012-13)
20,259 participants, 122,767 items
| Maximum | 2968 |
| Decile 9 | 749 |
| Decile 8 | 657 |
| Decile 7 | 609 |
| Decile 6 | 563 |
| Median | 532 |
| Decile 4 | 515 |
| Decile 3 | 484 |
| Decile 2 | 453 |
| Decile 1 | 421 |
| Minimum | 15 |
|
|
- There are 267 distinct values.
- Mean = 568.493
- Std.dev = 165.163
- 1830 items above graph maximum of 1077
|
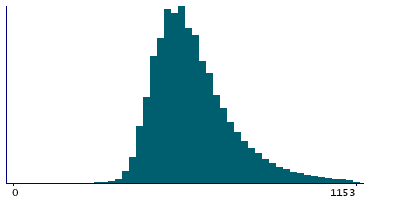
Instance 2 : Imaging visit (2014+)
78,420 participants, 473,305 items
| Maximum | 3010 |
| Decile 9 | 810 |
| Decile 8 | 703 |
| Decile 7 | 655 |
| Decile 6 | 610 |
| Median | 578 |
| Decile 4 | 561 |
| Decile 3 | 530 |
| Decile 2 | 499 |
| Decile 1 | 467 |
| Minimum | 0 |
|
|
- There are 677 distinct values.
- Mean = 619.727
- Std.dev = 177.936
- 7701 items above graph maximum of 1153
|
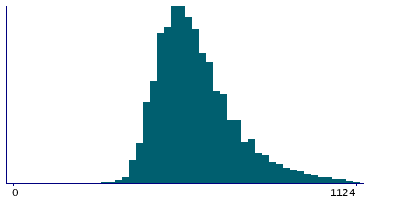
Instance 3 : First repeat imaging visit (2019+)
8,396 participants, 50,629 items
| Maximum | 2964 |
| Decile 9 | 796 |
| Decile 8 | 702 |
| Decile 7 | 655 |
| Decile 6 | 609 |
| Median | 578 |
| Decile 4 | 547 |
| Decile 3 | 530 |
| Decile 2 | 499 |
| Decile 1 | 468 |
| Minimum | 0 |
|
|
- There are 392 distinct values.
- Mean = 613.202
- Std.dev = 169.306
- 766 items above graph maximum of 1124
|
Notes
This gives the interval between the cards being displayed and the participant pressing the snap-button to indicate a match. Note that the time is recorded regardless of whether the cards shown formed a matching pair.
Field 401 and
Field 402 need to be compared to determine if the cards were the same.
Each pair was displayed for 2 seconds, followed by a 1 second gap. If the button-press occurred during a gap then it was recorded against the previous pair, giving a value in the range 2001-2999ms.


