Data
66,563 items of data are available, covering 64,150 participants.
Some values have special meanings defined by Data-Coding
100291.
Defined-instances run from 0 to 3, labelled using Instancing
2.
Units of measurement are days.
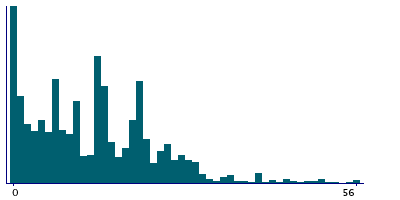
| Maximum | 365 |
| Decile 9 | 28 |
| Decile 8 | 21 |
| Decile 7 | 19 |
| Decile 6 | 14 |
| Median | 13 |
| Decile 4 | 9 |
| Decile 3 | 7 |
| Decile 2 | 3 |
| Decile 1 | 0 |
| Minimum | 0 |
|
|
- There are 162 distinct values.
- Mean = 15.3636
- Std.dev = 22.5783
- 1465 items above graph maximum of 56
- 797 items have value -3 (Prefer not to answer)
- 7499 items have value -1 (Do not know)
|
4 Instances
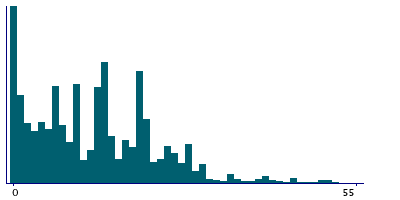
Instance 0 : Initial assessment visit (2006-2010) at which participants were recruited and consent given
63,982 participants, 63,982 items
| Maximum | 365 |
| Decile 9 | 28 |
| Decile 8 | 21 |
| Decile 7 | 19 |
| Decile 6 | 14 |
| Median | 13 |
| Decile 4 | 9 |
| Decile 3 | 7 |
| Decile 2 | 3 |
| Decile 1 | 1 |
| Minimum | 0 |
|
|
- There are 158 distinct values.
- Mean = 15.2297
- Std.dev = 22.3336
- 1439 items above graph maximum of 55
- 744 items have value -3 (Prefer not to answer)
- 7090 items have value -1 (Do not know)
|
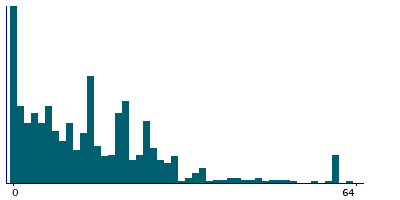
Instance 1 : First repeat assessment visit (2012-13)
1,046 participants, 1,046 items
| Maximum | 365 |
| Decile 9 | 32 |
| Decile 8 | 25 |
| Decile 7 | 20 |
| Decile 6 | 15.5 |
| Median | 14 |
| Decile 4 | 10 |
| Decile 3 | 6 |
| Decile 2 | 3 |
| Decile 1 | 0 |
| Minimum | 0 |
|
|
- There are 65 distinct values.
- Mean = 17.3112
- Std.dev = 23.8856
- 25 items above graph maximum of 64
- 14 items have value -3 (Prefer not to answer)
- 145 items have value -1 (Do not know)
|
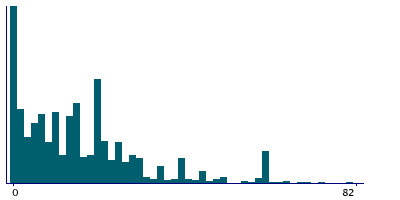
Instance 2 : Imaging visit (2014+)
1,464 participants, 1,464 items
| Maximum | 365 |
| Decile 9 | 41 |
| Decile 8 | 27 |
| Decile 7 | 21 |
| Decile 6 | 18 |
| Median | 14 |
| Decile 4 | 10 |
| Decile 3 | 7 |
| Decile 2 | 2 |
| Decile 1 | 0 |
| Minimum | 0 |
|
|
- There are 75 distinct values.
- Mean = 20.2564
- Std.dev = 31.1302
- 41 items above graph maximum of 82
- 35 items have value -3 (Prefer not to answer)
- 251 items have value -1 (Do not know)
|
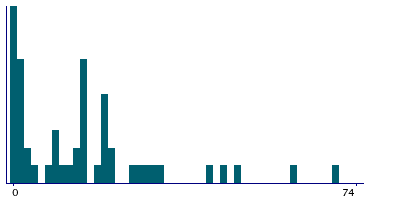
Instance 3 : First repeat imaging visit (2019+)
71 participants, 71 items
| Maximum | 79 |
| Decile 9 | 37 |
| Decile 8 | 23 |
| Decile 7 | 20 |
| Decile 6 | 15 |
| Median | 14 |
| Decile 4 | 7.5 |
| Decile 3 | 2 |
| Decile 2 | 1 |
| Decile 1 | 0 |
| Minimum | 0 |
|
|
- There are 25 distinct values.
- Mean = 15.8333
- Std.dev = 17.799
- 1 item above graph maximum of 74
- 4 items have value -3 (Prefer not to answer)
- 13 items have value -1 (Do not know)
|
Notes
ACE touchscreen question "How many days since your last menstrual period?"
The following checks were performed:
- If answer < 0 then rejected
- If answer > 365 then rejected
- If answer > 60 then participant asked to confirm
If the participant activated the Help button they were shown the message:
Please count from the first day of your last menstrual period
|
Field 3700 was collected from women who indicated that their periods had not stopped (menopause), as defined by their answers to Field 2724
Coding 100291 defines 2 special values:
- -1 represents "Do not know"
- -3 represents "Prefer not to answer"
1 Related Data-Field
| Field ID | Description | Relationship |
|---|
| 2724 | Had menopause | Current Field was collected from women who indicated that their periods had not stopped (menopause), as defined by their answers to Field 2724 |


