Data
290,952 items of data are available, covering 275,240 participants.
Defined-instances run from 0 to 1, labelled using Instancing
2.
Units of measurement are percent.
| Maximum | 33.438 |
| Decile 9 | 11.587 |
| Decile 8 | 10.064 |
| Decile 7 | 9.1634 |
| Decile 6 | 8.4998 |
| Median | 7.9564 |
| Decile 4 | 7.48055 |
| Decile 3 | 7.0262 |
| Decile 2 | 6.5566 |
| Decile 1 | 5.9897 |
| Minimum | 2.2594 |
|
|
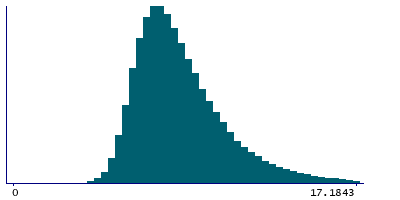
- Mean = 8.48152
- Std.dev = 2.49204
- 2887 items above graph maximum of 17.1843
|
2 Instances
Instance 0 : Initial assessment visit (2006-2010) at which participants were recruited and consent given
274,249 participants, 274,249 items
| Maximum | 33.438 |
| Decile 9 | 11.59 |
| Decile 8 | 10.062 |
| Decile 7 | 9.1601 |
| Decile 6 | 8.49615 |
| Median | 7.9504 |
| Decile 4 | 7.47495 |
| Decile 3 | 7.02075 |
| Decile 2 | 6.54985 |
| Decile 1 | 5.98375 |
| Minimum | 2.2594 |
|

|
- Mean = 8.47868
- Std.dev = 2.49822
- 2752 items above graph maximum of 17.1962
|
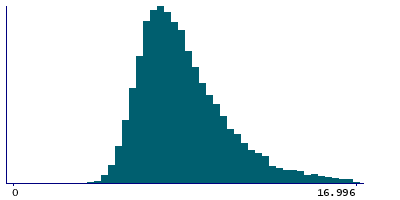
Instance 1 : First repeat assessment visit (2012-13)
16,703 participants, 16,703 items
| Maximum | 29.134 |
| Decile 9 | 11.544 |
| Decile 8 | 10.0945 |
| Decile 7 | 9.2209 |
| Decile 6 | 8.5698 |
| Median | 8.04835 |
| Decile 4 | 7.5701 |
| Decile 3 | 7.12125 |
| Decile 2 | 6.6557 |
| Decile 1 | 6.09205 |
| Minimum | 3.7104 |
|
|
- Mean = 8.52822
- Std.dev = 2.38787
- 134 items above graph maximum of 16.996
|


