Data
290,952 items of data are available, covering 275,240 participants.
Defined-instances run from 0 to 1, labelled using Instancing
2.
Units of measurement are mmol/l.
| Maximum | 1.3187 |
| Decile 9 | 0.415145 |
| Decile 8 | 0.33207 |
| Decile 7 | 0.27671 |
| Decile 6 | 0.234375 |
| Median | 0.19961 |
| Decile 4 | 0.16988 |
| Decile 3 | 0.143505 |
| Decile 2 | 0.11811 |
| Decile 1 | 0.089777 |
| Minimum | 7.9755e-09 |
|

|
- Mean = 0.229631
- Std.dev = 0.131734
- 650 items above graph maximum of 0.740513
|
2 Instances
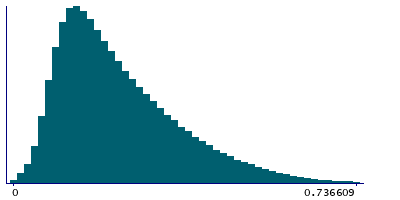
Instance 0 : Initial assessment visit (2006-2010) at which participants were recruited and consent given
274,249 participants, 274,249 items
| Maximum | 1.3187 |
| Decile 9 | 0.41295 |
| Decile 8 | 0.329875 |
| Decile 7 | 0.275 |
| Decile 6 | 0.2327 |
| Median | 0.19818 |
| Decile 4 | 0.16874 |
| Decile 3 | 0.14255 |
| Decile 2 | 0.11749 |
| Decile 1 | 0.0892905 |
| Minimum | 7.9755e-09 |
|
|
- Mean = 0.228262
- Std.dev = 0.131094
- 619 items above graph maximum of 0.736609
|
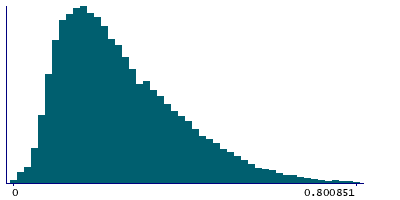
Instance 1 : First repeat assessment visit (2012-13)
16,703 participants, 16,703 items
| Maximum | 1.1057 |
| Decile 9 | 0.449775 |
| Decile 8 | 0.364685 |
| Decile 7 | 0.307075 |
| Decile 6 | 0.26015 |
| Median | 0.222505 |
| Decile 4 | 0.19032 |
| Decile 3 | 0.160565 |
| Decile 2 | 0.130385 |
| Decile 1 | 0.0986995 |
| Minimum | 1.9013e-07 |
|
|
- Mean = 0.252101
- Std.dev = 0.139914
- 22 items above graph maximum of 0.800851
|


