Data
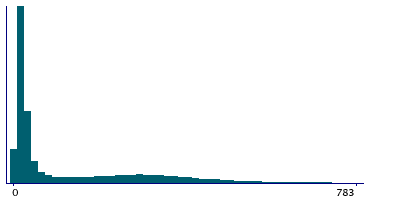
52,223 items of data are available, covering 48,149 participants.
Defined-instances run from 2 to 3, labelled using Instancing
2.
Units of measurement are seconds.
| Maximum | 2494 |
| Decile 9 | 397 |
| Decile 8 | 286 |
| Decile 7 | 175 |
| Decile 6 | 56 |
| Median | 30 |
| Decile 4 | 22 |
| Decile 3 | 18 |
| Decile 2 | 14 |
| Decile 1 | 11 |
| Minimum | 4 |
|
|
- There are 1102 distinct values.
- Mean = 135.929
- Std.dev = 185.945
- 504 items above graph maximum of 783
|
2 Instances
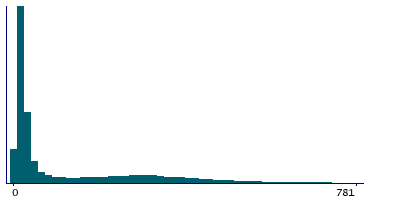
Instance 2 : Imaging visit (2014+)
46,548 participants, 46,548 items
| Maximum | 2494 |
| Decile 9 | 396 |
| Decile 8 | 283 |
| Decile 7 | 167 |
| Decile 6 | 52 |
| Median | 29 |
| Decile 4 | 22 |
| Decile 3 | 17 |
| Decile 2 | 14 |
| Decile 1 | 11 |
| Minimum | 4 |
|
|
- There are 1085 distinct values.
- Mean = 134.345
- Std.dev = 186.496
- 461 items above graph maximum of 781
|
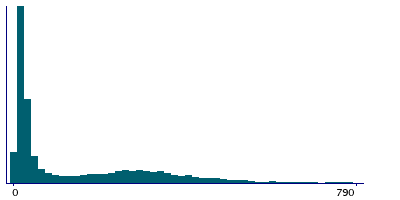
Instance 3 : First repeat imaging visit (2019+)
5,675 participants, 5,675 items
| Maximum | 1745 |
| Decile 9 | 401 |
| Decile 8 | 303 |
| Decile 7 | 225 |
| Decile 6 | 110 |
| Median | 41 |
| Decile 4 | 26 |
| Decile 3 | 20 |
| Decile 2 | 17 |
| Decile 1 | 12 |
| Minimum | 5 |
|
|
- There are 674 distinct values.
- Mean = 148.919
- Std.dev = 180.843
- 46 items above graph maximum of 790
|
Notes
Cardiac monitor duration
0 Related Data-Fields
There are no related data-fields
0 Resources
There are no matching Resources
