Data
93,130 items of data are available, covering 84,546 participants.
Defined-instances run from 2 to 3, labelled using Instancing
2.
Units of measurement are seconds.
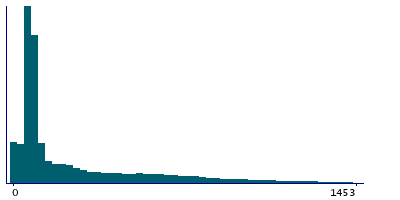
| Maximum | 6253 |
| Decile 9 | 746 |
| Decile 8 | 484 |
| Decile 7 | 274 |
| Decile 6 | 149 |
| Median | 93 |
| Decile 4 | 78 |
| Decile 3 | 70 |
| Decile 2 | 64 |
| Decile 1 | 39 |
| Minimum | 4 |
|
|
- There are 1853 distinct values.
- Mean = 263.73
- Std.dev = 324.971
- 752 items above graph maximum of 1453
|
2 Instances
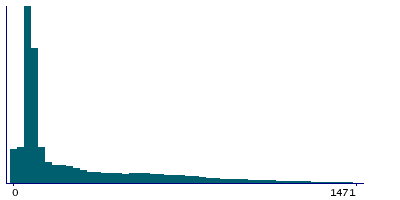
Instance 2 : Imaging visit (2014+)
84,286 participants, 84,286 items
| Maximum | 6253 |
| Decile 9 | 762 |
| Decile 8 | 508 |
| Decile 7 | 295 |
| Decile 6 | 163 |
| Median | 96 |
| Decile 4 | 79 |
| Decile 3 | 70 |
| Decile 2 | 65 |
| Decile 1 | 53 |
| Minimum | 4 |
|
|
- There are 1815 distinct values.
- Mean = 272.519
- Std.dev = 327.942
- 616 items above graph maximum of 1471
|
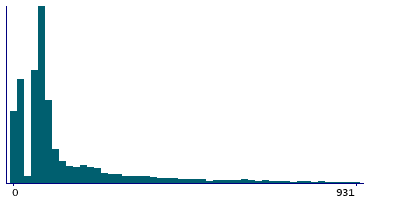
Instance 3 : First repeat imaging visit (2019+)
8,844 participants, 8,844 items
| Maximum | 3790 |
| Decile 9 | 462.5 |
| Decile 8 | 229 |
| Decile 7 | 132 |
| Decile 6 | 92 |
| Median | 79 |
| Decile 4 | 71 |
| Decile 3 | 64 |
| Decile 2 | 26 |
| Decile 1 | 11 |
| Minimum | 4 |
|
|
- There are 1018 distinct values.
- Mean = 179.968
- Std.dev = 281.724
- 311 items above graph maximum of 914
|
Notes
ECG at rest duration
0 Related Data-Fields
There are no related data-fields
0 Resources
There are no matching Resources
