Data
93,619 items of data are available, covering 84,773 participants.
Defined-instances run from 2 to 3, labelled using Instancing
2.
Units of measurement are seconds.
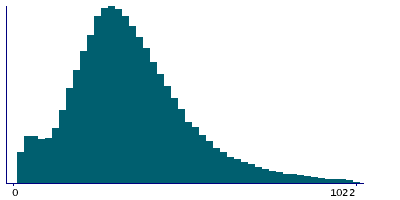
| Maximum | 4224 |
| Decile 9 | 585 |
| Decile 8 | 478 |
| Decile 7 | 415 |
| Decile 6 | 368 |
| Median | 327 |
| Decile 4 | 290 |
| Decile 3 | 253 |
| Decile 2 | 210 |
| Decile 1 | 148 |
| Minimum | 16 |
|
|
- There are 1387 distinct values.
- Mean = 354.624
- Std.dev = 191.192
- 787 items above graph maximum of 1022
|
2 Instances
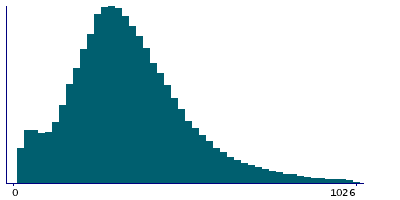
Instance 2 : Imaging visit (2014+)
84,770 participants, 84,770 items
| Maximum | 4224 |
| Decile 9 | 583 |
| Decile 8 | 476 |
| Decile 7 | 414 |
| Decile 6 | 366 |
| Median | 325 |
| Decile 4 | 288 |
| Decile 3 | 250 |
| Decile 2 | 205 |
| Decile 1 | 140 |
| Minimum | 16 |
|
|
- There are 1351 distinct values.
- Mean = 351.249
- Std.dev = 191.04
- 661 items above graph maximum of 1026
|
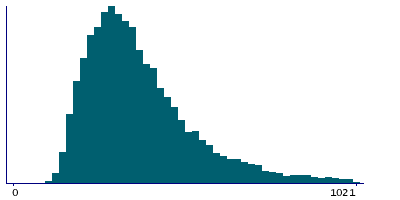
Instance 3 : First repeat imaging visit (2019+)
8,849 participants, 8,849 items
| Maximum | 2914 |
| Decile 9 | 614 |
| Decile 8 | 493 |
| Decile 7 | 427.5 |
| Decile 6 | 381 |
| Median | 344 |
| Decile 4 | 310 |
| Decile 3 | 279 |
| Decile 2 | 245 |
| Decile 1 | 207 |
| Minimum | 99 |
|
|
- There are 905 distinct values.
- Mean = 386.95
- Std.dev = 189.628
- 115 items above graph maximum of 1021
|
Notes
Imaging screening duration
0 Related Data-Fields
There are no related data-fields
0 Resources
There are no matching Resources
