Data
92,565 items of data are available, covering 83,893 participants.
Defined-instances run from 2 to 3, labelled using Instancing
2.
Units of measurement are seconds.
| Maximum | 5278 |
| Decile 9 | 458 |
| Decile 8 | 363 |
| Decile 7 | 306 |
| Decile 6 | 266 |
| Median | 233 |
| Decile 4 | 204 |
| Decile 3 | 180 |
| Decile 2 | 158 |
| Decile 1 | 131 |
| Minimum | 10 |
|

|
- There are 1273 distinct values.
- Mean = 271.551
- Std.dev = 162.162
- 1436 items above graph maximum of 785
|
2 Instances
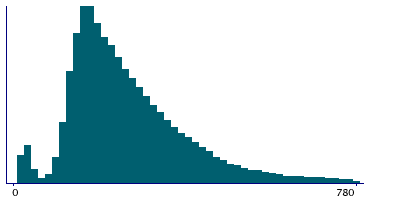
Instance 2 : Imaging visit (2014+)
83,754 participants, 83,754 items
| Maximum | 5278 |
| Decile 9 | 455 |
| Decile 8 | 362 |
| Decile 7 | 306 |
| Decile 6 | 265 |
| Median | 231 |
| Decile 4 | 203 |
| Decile 3 | 178 |
| Decile 2 | 156 |
| Decile 1 | 130 |
| Minimum | 10 |
|
|
- There are 1249 distinct values.
- Mean = 269.948
- Std.dev = 161.043
- 1279 items above graph maximum of 780
|
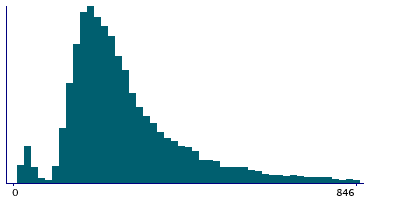
Instance 3 : First repeat imaging visit (2019+)
8,811 participants, 8,811 items
| Maximum | 2340 |
| Decile 9 | 495 |
| Decile 8 | 378 |
| Decile 7 | 312 |
| Decile 6 | 271 |
| Median | 241 |
| Decile 4 | 216 |
| Decile 3 | 192.5 |
| Decile 2 | 171 |
| Decile 1 | 144 |
| Minimum | 13 |
|
|
- There are 862 distinct values.
- Mean = 286.792
- Std.dev = 171.695
- 138 items above graph maximum of 846
|
Notes
Sample collection duration
0 Related Data-Fields
There are no related data-fields
0 Resources
There are no matching Resources
