Data
91,786 items of data are available, covering 83,425 participants.
Defined-instances run from 2 to 3, labelled using Instancing
2.
Units of measurement are seconds.
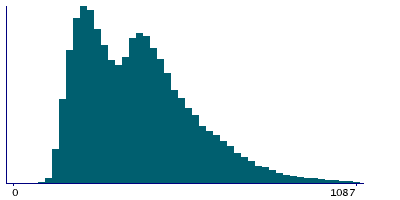
| Maximum | 4665 |
| Decile 9 | 641 |
| Decile 8 | 535 |
| Decile 7 | 470 |
| Decile 6 | 420 |
| Median | 376 |
| Decile 4 | 323 |
| Decile 3 | 273 |
| Decile 2 | 233 |
| Decile 1 | 195 |
| Minimum | 39 |
|
|
- There are 1226 distinct values.
- Mean = 398.147
- Std.dev = 182.956
- 332 items above graph maximum of 1087
|
2 Instances
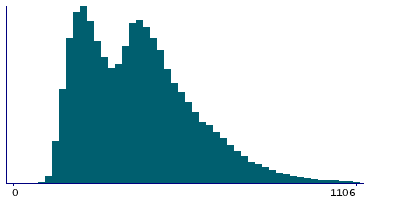
Instance 2 : Imaging visit (2014+)
83,004 participants, 83,004 items
| Maximum | 4665 |
| Decile 9 | 650.5 |
| Decile 8 | 547 |
| Decile 7 | 481 |
| Decile 6 | 431 |
| Median | 388 |
| Decile 4 | 339 |
| Decile 3 | 280 |
| Decile 2 | 234 |
| Decile 1 | 195 |
| Minimum | 39 |
|
|
- There are 1214 distinct values.
- Mean = 406.543
- Std.dev = 185.242
- 267 items above graph maximum of 1106
|
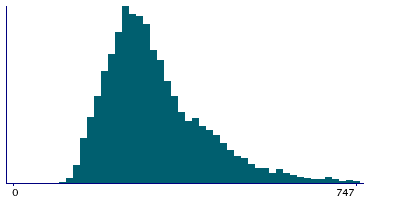
Instance 3 : First repeat imaging visit (2019+)
8,782 participants, 8,782 items
| Maximum | 1816 |
| Decile 9 | 470 |
| Decile 8 | 397 |
| Decile 7 | 346 |
| Decile 6 | 313 |
| Median | 288 |
| Decile 4 | 266 |
| Decile 3 | 245 |
| Decile 2 | 222 |
| Decile 1 | 193 |
| Minimum | 107 |
|
|
- There are 697 distinct values.
- Mean = 318.79
- Std.dev = 136.211
- 138 items above graph maximum of 747
|
Notes
Biometrics duration
0 Related Data-Fields
There are no related data-fields
0 Resources
There are no matching Resources
