Data
177,972 items of data are available, covering 153,484 participants.
Defined-instances run from 0 to 3, labelled using Instancing
2.
Units of measurement are Units.
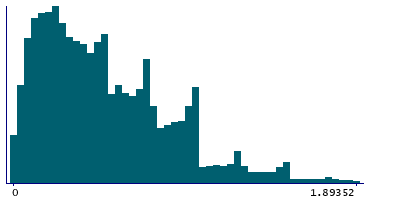
| Maximum | 7 |
| Decile 9 | 1 |
| Decile 8 | 0.815509 |
| Decile 7 | 0.67424 |
| Decile 6 | 0.532609 |
| Median | 0.438679 |
| Decile 4 | 0.34375 |
| Decile 3 | 0.255952 |
| Decile 2 | 0.183673 |
| Decile 1 | 0.106481 |
| Minimum | 0 |
|
|
- Mean = 0.525596
- Std.dev = 0.40911
- 1928 items above graph maximum of 1.89352
|
4 Instances
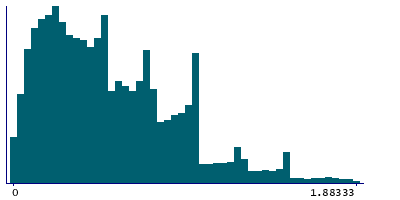
Instance 0 : Initial assessment visit (2006-2010) at which participants were recruited and consent given
150,840 participants, 150,840 items
| Maximum | 7 |
| Decile 9 | 1 |
| Decile 8 | 0.857143 |
| Decile 7 | 0.706897 |
| Decile 6 | 0.570312 |
| Median | 0.465909 |
| Decile 4 | 0.36875 |
| Decile 3 | 0.277778 |
| Decile 2 | 0.198936 |
| Decile 1 | 0.116667 |
| Minimum | 0 |
|
|
- Mean = 0.550755
- Std.dev = 0.418729
- 1883 items above graph maximum of 1.88333
|
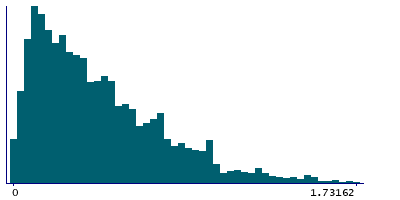
Instance 1 : First repeat assessment visit (2012-13)
5,339 participants, 5,339 items
| Maximum | 3 |
| Decile 9 | 0.910485 |
| Decile 8 | 0.702254 |
| Decile 7 | 0.551724 |
| Decile 6 | 0.449027 |
| Median | 0.354167 |
| Decile 4 | 0.277429 |
| Decile 3 | 0.208248 |
| Decile 2 | 0.144868 |
| Decile 1 | 0.0887841 |
| Minimum | 0 |
|
|
- Mean = 0.442976
- Std.dev = 0.356995
- 46 items above graph maximum of 1.73219
|
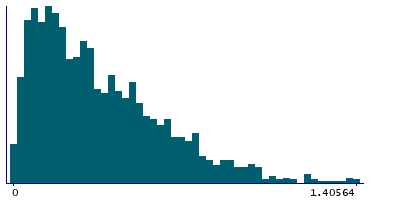
Instance 2 : Imaging visit (2014+)
19,837 participants, 19,837 items
| Maximum | 3.5 |
| Decile 9 | 0.760016 |
| Decile 8 | 0.591592 |
| Decile 7 | 0.46875 |
| Decile 6 | 0.372549 |
| Median | 0.293805 |
| Decile 4 | 0.231481 |
| Decile 3 | 0.174301 |
| Decile 2 | 0.12234 |
| Decile 1 | 0.0714286 |
| Minimum | 0 |
|

|
- Mean = 0.372782
- Std.dev = 0.304133
- 159 items above graph maximum of 1.4486
|
Instance 3 : First repeat imaging visit (2019+)
1,956 participants, 1,956 items
| Maximum | 3.5 |
| Decile 9 | 0.733854 |
| Decile 8 | 0.564907 |
| Decile 7 | 0.454152 |
| Decile 6 | 0.361886 |
| Median | 0.290094 |
| Decile 4 | 0.221103 |
| Decile 3 | 0.168929 |
| Decile 2 | 0.118421 |
| Decile 1 | 0.0693376 |
| Minimum | 0 |
|
|
- Mean = 0.360682
- Std.dev = 0.300198
- 19 items above graph maximum of 1.39837
|
Notes
Average number of pack-years smoked by an individual each year, over their adult lifetime, calculated using pack-years data field. Pack years as a proportion of lifespan exposed to smoking is defined as pack years divided by the number of years between the participants' age at recruitment and the age of 16:
Pack years / (Age at recruitment - 16)
This derived data field has come from Professor Martin Tobin at the University of Leicester.

