Data
272,495 items of data are available, covering 226,175 participants.
Defined-instances run from 0 to 3, labelled using Instancing
2.
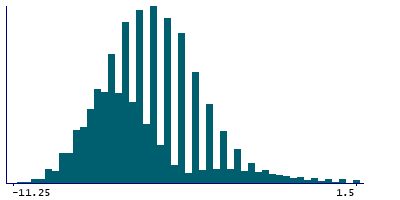
| Maximum | 8 |
| Decile 9 | -3.5 |
| Decile 8 | -4.5 |
| Decile 7 | -5.5 |
| Decile 6 | -6 |
| Median | -6.5 |
| Decile 4 | -7 |
| Decile 3 | -7.5 |
| Decile 2 | -8 |
| Decile 1 | -8.5 |
| Minimum | -11.25 |
|
|
- Mean = -6.06971
- Std.dev = 2.33362
- 3322 items above graph maximum of 1.5
|
4 Instances
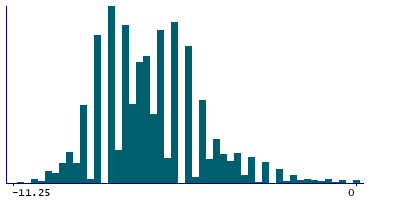
Instance 0 : Initial assessment visit (2006-2010) at which participants were recruited and consent given
163,148 participants, 163,148 items
| Maximum | 8 |
| Decile 9 | -4.5 |
| Decile 8 | -5.5 |
| Decile 7 | -6 |
| Decile 6 | -6.5 |
| Median | -7 |
| Decile 4 | -7.5 |
| Decile 3 | -7.5 |
| Decile 2 | -8 |
| Decile 1 | -8.5 |
| Minimum | -11.25 |
|
|
- Mean = -6.58683
- Std.dev = 2.09715
- 1847 items above graph maximum of 0
|
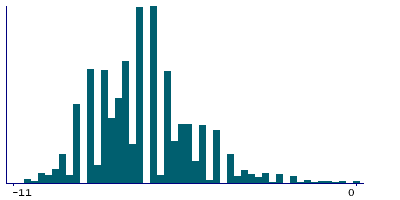
Instance 1 : First repeat assessment visit (2012-13)
19,830 participants, 19,830 items
| Maximum | 8 |
| Decile 9 | -4.5 |
| Decile 8 | -5.5 |
| Decile 7 | -6 |
| Decile 6 | -6.5 |
| Median | -7 |
| Decile 4 | -7.5 |
| Decile 3 | -7.5 |
| Decile 2 | -8 |
| Decile 1 | -8.5 |
| Minimum | -11 |
|
|
- Mean = -6.70581
- Std.dev = 1.97253
- 188 items above graph maximum of 0
|
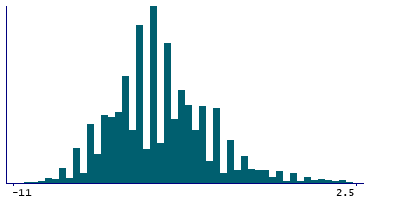
Instance 2 : Imaging visit (2014+)
80,887 participants, 80,887 items
| Maximum | 8 |
| Decile 9 | -2.5 |
| Decile 8 | -3.5 |
| Decile 7 | -4.5 |
| Decile 6 | -5 |
| Median | -5.5 |
| Decile 4 | -6 |
| Decile 3 | -6.5 |
| Decile 2 | -7 |
| Decile 1 | -7.5 |
| Minimum | -11 |
|
|
- Mean = -4.99441
- Std.dev = 2.44584
- 1460 items above graph maximum of 2.5
|
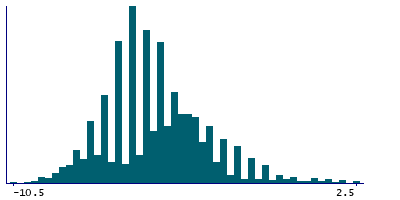
Instance 3 : First repeat imaging visit (2019+)
8,630 participants, 8,630 items
| Maximum | 8 |
| Decile 9 | -2.5 |
| Decile 8 | -3.5 |
| Decile 7 | -4 |
| Decile 6 | -5 |
| Median | -5 |
| Decile 4 | -5.5 |
| Decile 3 | -6 |
| Decile 2 | -6.5 |
| Decile 1 | -7.5 |
| Minimum | -10.5 |
|
|
- Mean = -4.91066
- Std.dev = 2.3735
- 140 items above graph maximum of 2.5
|


