Data
614,420 items of data are available, covering 501,300 participants.
Some values have special meanings defined by Data-Coding
100373.
Defined-instances run from 0 to 3, labelled using Instancing
2.
Units of measurement are cups/day.
| Maximum | 99 |
| Decile 9 | 6 |
| Decile 8 | 5 |
| Decile 7 | 5 |
| Decile 6 | 4 |
| Median | 3 |
| Decile 4 | 3 |
| Decile 3 | 2 |
| Decile 2 | 1 |
| Decile 1 | 0 |
| Minimum | 0 |
|
|
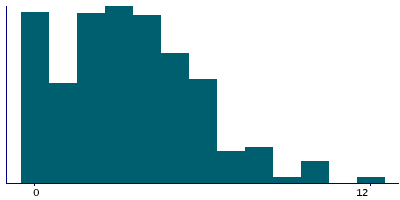
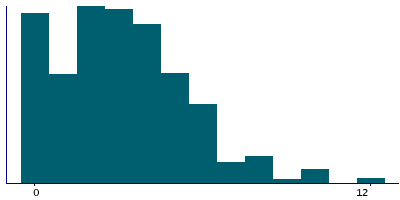
- There are 54 distinct values.
- Mean = 3.48432
- Std.dev = 2.832
- 4817 items above graph maximum of 12
- 18649 items have value -10 (Less than one)
- 295 items have value -3 (Prefer not to answer)
- 1082 items have value -1 (Do not know)
|
4 Instances
Instance 0 : Initial assessment visit (2006-2010) at which participants were recruited and consent given
501,268 participants, 501,268 items
| Maximum | 99 |
| Decile 9 | 7 |
| Decile 8 | 5 |
| Decile 7 | 5 |
| Decile 6 | 4 |
| Median | 3 |
| Decile 4 | 3 |
| Decile 3 | 2 |
| Decile 2 | 1 |
| Decile 1 | 0 |
| Minimum | 0 |
|
|
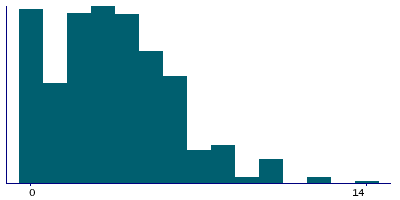
- There are 53 distinct values.
- Mean = 3.51772
- Std.dev = 2.87951
- 3099 items above graph maximum of 14
- 15444 items have value -10 (Less than one)
- 276 items have value -3 (Prefer not to answer)
- 1019 items have value -1 (Do not know)
|
Instance 1 : First repeat assessment visit (2012-13)
20,328 participants, 20,328 items
| Maximum | 50 |
| Decile 9 | 7 |
| Decile 8 | 6 |
| Decile 7 | 5 |
| Decile 6 | 4 |
| Median | 3 |
| Decile 4 | 3 |
| Decile 3 | 2 |
| Decile 2 | 1 |
| Decile 1 | 0 |
| Minimum | 0 |
|
|
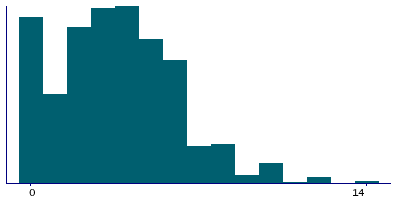
- There are 27 distinct values.
- Mean = 3.61268
- Std.dev = 2.75719
- 87 items above graph maximum of 14
- 568 items have value -10 (Less than one)
- 5 items have value -3 (Prefer not to answer)
- 14 items have value -1 (Do not know)
|
Instance 2 : Imaging visit (2014+)
84,020 participants, 84,020 items
| Maximum | 84 |
| Decile 9 | 6 |
| Decile 8 | 5 |
| Decile 7 | 4 |
| Decile 6 | 4 |
| Median | 3 |
| Decile 4 | 2 |
| Decile 3 | 2 |
| Decile 2 | 1 |
| Decile 1 | 0 |
| Minimum | 0 |
|
|
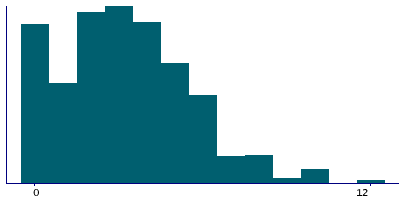
- There are 32 distinct values.
- Mean = 3.28952
- Std.dev = 2.56758
- 469 items above graph maximum of 12
- 2398 items have value -10 (Less than one)
- 13 items have value -3 (Prefer not to answer)
- 46 items have value -1 (Do not know)
|
Instance 3 : First repeat imaging visit (2019+)
8,804 participants, 8,804 items
| Maximum | 50 |
| Decile 9 | 6 |
| Decile 8 | 5 |
| Decile 7 | 4 |
| Decile 6 | 4 |
| Median | 3 |
| Decile 4 | 2 |
| Decile 3 | 2 |
| Decile 2 | 1 |
| Decile 1 | 0 |
| Minimum | 0 |
|
|
- There are 23 distinct values.
- Mean = 3.15372
- Std.dev = 2.58028
- 33 items above graph maximum of 12
- 239 items have value -10 (Less than one)
- 1 items have value -3 (Prefer not to answer)
- 3 items have value -1 (Do not know)
|
Notes
ACE touchscreen question "How many cups of tea do you drink each DAY? (Include black and green tea)"
The following checks were performed:
- If answer < 0 then rejected
- If answer > 99 then rejected
- If answer > 20 then participant asked to confirm
If the participant activated the Help button they were shown the message:
Please provide an average considering your intake over the last year.
If you are unsure, please provide an estimate or select Do not know.
|
Coding 100373 defines 3 special values:
- -10 represents "Less than one"
- -1 represents "Do not know"
- -3 represents "Prefer not to answer"
0 Related Data-Fields
There are no related data-fields


