Data
602,869 items of data are available, covering 501,329 participants.
Defined-instances run from 0 to 3, labelled using Instancing
2.
| Maximum | 48 |
| Decile 9 | 6 |
| Decile 8 | 4 |
| Decile 7 | 3 |
| Decile 6 | 2 |
| Median | 2 |
| Decile 4 | 1 |
| Decile 3 | 1 |
| Decile 2 | 0 |
| Decile 1 | 0 |
| Minimum | 0 |
|

|
- There are 33 distinct values.
- Mean = 2.42042
- Std.dev = 2.63851
- 3848 items above graph maximum of 12
|
4 Instances
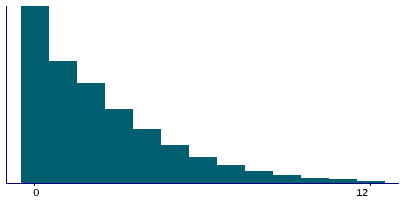
Instance 0 : Initial assessment visit (2006-2010) at which participants were recruited and consent given
501,304 participants, 501,304 items
| Maximum | 48 |
| Decile 9 | 6 |
| Decile 8 | 4 |
| Decile 7 | 3 |
| Decile 6 | 2 |
| Median | 2 |
| Decile 4 | 1 |
| Decile 3 | 1 |
| Decile 2 | 0 |
| Decile 1 | 0 |
| Minimum | 0 |
|
|
- There are 33 distinct values.
- Mean = 2.46004
- Std.dev = 2.68125
- 3452 items above graph maximum of 12
|
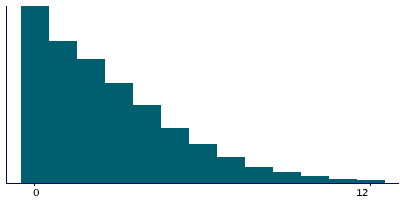
Instance 1 : First repeat assessment visit (2012-13)
20,327 participants, 20,327 items
| Maximum | 28 |
| Decile 9 | 6 |
| Decile 8 | 5 |
| Decile 7 | 4 |
| Decile 6 | 3 |
| Median | 2 |
| Decile 4 | 1 |
| Decile 3 | 1 |
| Decile 2 | 0 |
| Decile 1 | 0 |
| Minimum | 0 |
|
|
- There are 25 distinct values.
- Mean = 2.73695
- Std.dev = 2.71592
- 143 items above graph maximum of 12
|
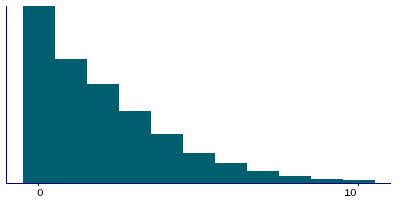
Instance 2 : Imaging visit (2014+)
73,823 participants, 73,823 items
| Maximum | 30 |
| Decile 9 | 5 |
| Decile 8 | 4 |
| Decile 7 | 3 |
| Decile 6 | 2 |
| Median | 1 |
| Decile 4 | 1 |
| Decile 3 | 1 |
| Decile 2 | 0 |
| Decile 1 | 0 |
| Minimum | 0 |
|
|
- There are 28 distinct values.
- Mean = 2.11368
- Std.dev = 2.31629
- 588 items above graph maximum of 10
|
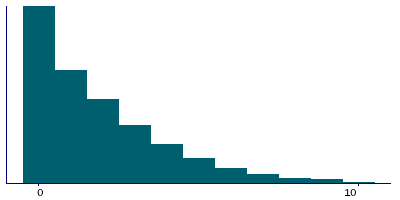
Instance 3 : First repeat imaging visit (2019+)
7,415 participants, 7,415 items
| Maximum | 19 |
| Decile 9 | 5 |
| Decile 8 | 3 |
| Decile 7 | 3 |
| Decile 6 | 2 |
| Median | 1 |
| Decile 4 | 1 |
| Decile 3 | 0 |
| Decile 2 | 0 |
| Decile 1 | 0 |
| Minimum | 0 |
|
|
- There are 17 distinct values.
- Mean = 1.92812
- Std.dev = 2.18851
- 42 items above graph maximum of 10
|

