Data
155,386 items of data are available, covering 71,922 participants.
Defined-instances run from 2 to 3, labelled using Instancing
2.
Array indices run from 0 to 4.
Units of measurement are mmHg.
| Maximum | 191 |
| Decile 9 | 84 |
| Decile 8 | 79 |
| Decile 7 | 75 |
| Decile 6 | 72 |
| Median | 70 |
| Decile 4 | 67 |
| Decile 3 | 64 |
| Decile 2 | 60 |
| Decile 1 | 55 |
| Minimum | 11 |
|

|
- There are 143 distinct values.
- Mean = 69.5964
- Std.dev = 11.8199
- 146 items above graph maximum of 113
|
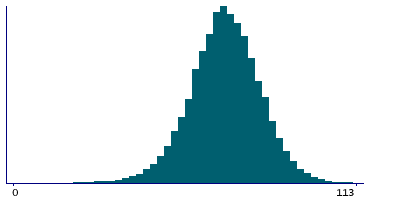
2 Instances
Instance 2 : Imaging visit (2014+)
70,436 participants, 139,145 items
| Maximum | 191 |
| Decile 9 | 84 |
| Decile 8 | 79 |
| Decile 7 | 76 |
| Decile 6 | 73 |
| Median | 70 |
| Decile 4 | 67 |
| Decile 3 | 64 |
| Decile 2 | 61 |
| Decile 1 | 55 |
| Minimum | 11 |
|
|
- There are 142 distinct values.
- Mean = 69.6843
- Std.dev = 11.9
- 134 items above graph maximum of 113
|
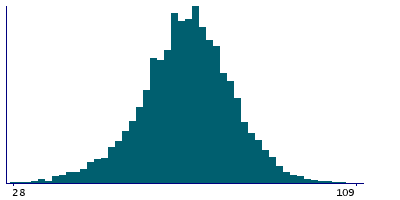
Instance 3 : First repeat imaging visit (2019+)
8,158 participants, 16,241 items
| Maximum | 154 |
| Decile 9 | 82 |
| Decile 8 | 78 |
| Decile 7 | 74 |
| Decile 6 | 72 |
| Median | 69 |
| Decile 4 | 67 |
| Decile 3 | 64 |
| Decile 2 | 60 |
| Decile 1 | 55 |
| Minimum | 19 |
|
|
- There are 94 distinct values.
- Mean = 68.8428
- Std.dev = 11.0817
- 20 items below graph minimum of 28
- 17 items above graph maximum of 109
|
Notes
Diastolic brachial blood pressure during PWA
0 Related Data-Fields
There are no related data-fields

