Data
82,681 items of data are available, covering 76,607 participants.
Defined-instances run from 2 to 3, labelled using Instancing
2.
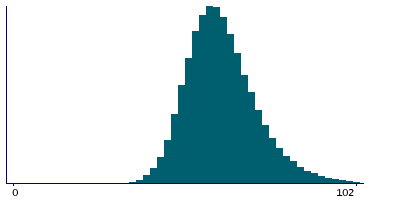
Units of measurement are bpm.
| Maximum | 211 |
| Decile 9 | 76 |
| Decile 8 | 70 |
| Decile 7 | 66 |
| Decile 6 | 63 |
| Median | 61 |
| Decile 4 | 59 |
| Decile 3 | 56 |
| Decile 2 | 53 |
| Decile 1 | 50 |
| Minimum | 0 |
|
|
- There are 146 distinct values.
- Mean = 62.1218
- Std.dev = 10.9715
- 298 items above graph maximum of 102
|
2 Instances
Instance 2 : Imaging visit (2014+)
75,754 participants, 75,754 items
| Maximum | 211 |
| Decile 9 | 76 |
| Decile 8 | 70 |
| Decile 7 | 66 |
| Decile 6 | 64 |
| Median | 61 |
| Decile 4 | 59 |
| Decile 3 | 56 |
| Decile 2 | 53 |
| Decile 1 | 50 |
| Minimum | 0 |
|

|
- There are 144 distinct values.
- Mean = 62.2396
- Std.dev = 11.0028
- 279 items above graph maximum of 102
|
Instance 3 : First repeat imaging visit (2019+)
6,927 participants, 6,927 items
| Maximum | 169 |
| Decile 9 | 74 |
| Decile 8 | 69 |
| Decile 7 | 65 |
| Decile 6 | 62 |
| Median | 60 |
| Decile 4 | 57 |
| Decile 3 | 55 |
| Decile 2 | 52 |
| Decile 1 | 49 |
| Minimum | 0 |
|

|
- There are 82 distinct values.
- Mean = 60.8344
- Std.dev = 10.538
- 27 items above graph maximum of 99
|
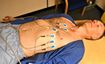
Notes
Ventricular rate during ECG measurement.
0 Related Data-Fields
There are no related data-fields