Data
614,434 items of data are available, covering 501,313 participants.
Some values have special meanings defined by Data-Coding
100329.
Defined-instances run from 0 to 3, labelled using Instancing
2.
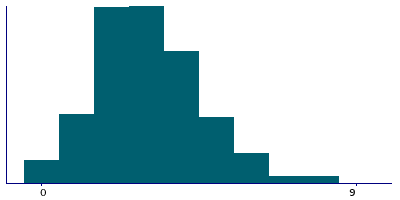
Units of measurement are hours/day.
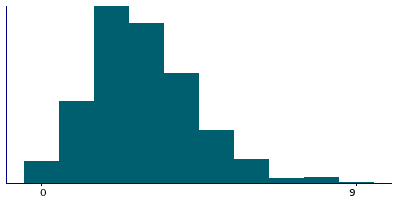
| Maximum | 24 |
| Decile 9 | 5 |
| Decile 8 | 4 |
| Decile 7 | 4 |
| Decile 6 | 3 |
| Median | 3 |
| Decile 4 | 2 |
| Decile 3 | 2 |
| Decile 2 | 2 |
| Decile 1 | 1 |
| Minimum | 0 |
|
|
- There are 24 distinct values.
- Mean = 2.92777
- Std.dev = 1.6241
- 2130 items above graph maximum of 9
- 27217 items have value -10 (Less than an hour a day)
- 817 items have value -3 (Prefer not to answer)
- 4106 items have value -1 (Do not know)
|
4 Instances
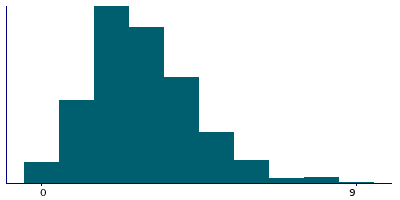
Instance 0 : Initial assessment visit (2006-2010) at which participants were recruited and consent given
501,282 participants, 501,282 items
| Maximum | 24 |
| Decile 9 | 5 |
| Decile 8 | 4 |
| Decile 7 | 4 |
| Decile 6 | 3 |
| Median | 3 |
| Decile 4 | 2 |
| Decile 3 | 2 |
| Decile 2 | 2 |
| Decile 1 | 1 |
| Minimum | 0 |
|
|
- There are 24 distinct values.
- Mean = 2.91264
- Std.dev = 1.63775
- 1902 items above graph maximum of 9
- 23343 items have value -10 (Less than an hour a day)
- 759 items have value -3 (Prefer not to answer)
- 3769 items have value -1 (Do not know)
|
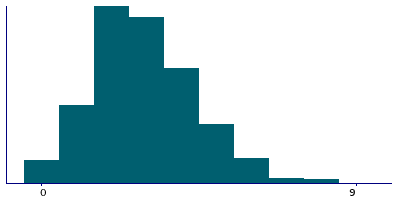
Instance 1 : First repeat assessment visit (2012-13)
20,328 participants, 20,328 items
| Maximum | 17 |
| Decile 9 | 5 |
| Decile 8 | 4 |
| Decile 7 | 4 |
| Decile 6 | 3 |
| Median | 3 |
| Decile 4 | 2 |
| Decile 3 | 2 |
| Decile 2 | 2 |
| Decile 1 | 1 |
| Minimum | 0 |
|
|
- There are 15 distinct values.
- Mean = 2.94087
- Std.dev = 1.5613
- 47 items above graph maximum of 9
- 877 items have value -10 (Less than an hour a day)
- 6 items have value -3 (Prefer not to answer)
- 64 items have value -1 (Do not know)
|
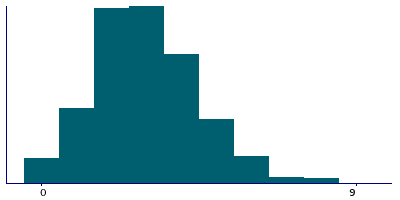
Instance 2 : Imaging visit (2014+)
84,020 participants, 84,020 items
| Maximum | 20 |
| Decile 9 | 5 |
| Decile 8 | 4 |
| Decile 7 | 4 |
| Decile 6 | 3 |
| Median | 3 |
| Decile 4 | 2 |
| Decile 3 | 2 |
| Decile 2 | 2 |
| Decile 1 | 1 |
| Minimum | 0 |
|
|
- There are 19 distinct values.
- Mean = 2.9989
- Std.dev = 1.56092
- 168 items above graph maximum of 9
- 2748 items have value -10 (Less than an hour a day)
- 50 items have value -3 (Prefer not to answer)
- 254 items have value -1 (Do not know)
|
Instance 3 : First repeat imaging visit (2019+)
8,804 participants, 8,804 items
| Maximum | 15 |
| Decile 9 | 5 |
| Decile 8 | 4 |
| Decile 7 | 4 |
| Decile 6 | 3 |
| Median | 3 |
| Decile 4 | 3 |
| Decile 3 | 2 |
| Decile 2 | 2 |
| Decile 1 | 1 |
| Minimum | 0 |
|
|
- There are 15 distinct values.
- Mean = 3.06246
- Std.dev = 1.56582
- 13 items above graph maximum of 9
- 249 items have value -10 (Less than an hour a day)
- 2 items have value -3 (Prefer not to answer)
- 19 items have value -1 (Do not know)
|
Notes
ACE touchscreen question "In a typical DAY, how many hours do you spend watching TV? (Put 0 if you do not spend any time doing it)"
The following checks were performed:
- If answer < 0 then rejected
- If answer > 24 then rejected
- If answer > 8 then participant asked to confirm
If the participant activated the Help button they were shown the message:
If the time you spend watching TV varies a lot, give
the average time for a 24 hour day in the last 4 weeks.
|
Coding 100329 defines 3 special values:
- -10 represents "Less than an hour a day"
- -1 represents "Do not know"
- -3 represents "Prefer not to answer"
0 Related Data-Fields
There are no related data-fields


