Data
610,668 items of data are available, covering 498,733 participants.
Some values have special meanings defined by Data-Coding
100329.
Defined-instances run from 0 to 3, labelled using Instancing
2.
Units of measurement are hours/day.
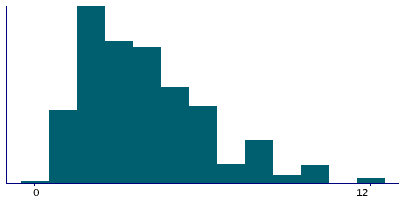
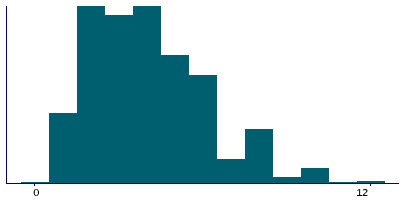
| Maximum | 24 |
| Decile 9 | 7 |
| Decile 8 | 6 |
| Decile 7 | 5 |
| Decile 6 | 4 |
| Median | 4 |
| Decile 4 | 3 |
| Decile 3 | 2 |
| Decile 2 | 2 |
| Decile 1 | 2 |
| Minimum | 0 |
|
|
- There are 25 distinct values.
- Mean = 3.95822
- Std.dev = 2.31377
- 1587 items above graph maximum of 12
- 22941 items have value -10 (Less than an hour a day)
- 807 items have value -3 (Prefer not to answer)
- 31741 items have value -1 (Do not know)
|
4 Instances
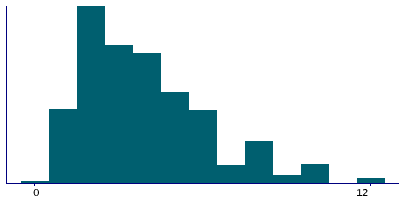
Instance 0 : Initial assessment visit (2006-2010) at which participants were recruited and consent given
497,516 participants, 497,516 items
| Maximum | 24 |
| Decile 9 | 7 |
| Decile 8 | 6 |
| Decile 7 | 5 |
| Decile 6 | 4 |
| Median | 3 |
| Decile 4 | 3 |
| Decile 3 | 2 |
| Decile 2 | 2 |
| Decile 1 | 2 |
| Minimum | 0 |
|
|
- There are 25 distinct values.
- Mean = 3.94148
- Std.dev = 2.34727
- 1429 items above graph maximum of 12
- 19844 items have value -10 (Less than an hour a day)
- 749 items have value -3 (Prefer not to answer)
- 28219 items have value -1 (Do not know)
|
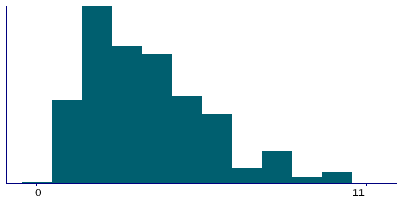
Instance 1 : First repeat assessment visit (2012-13)
20,328 participants, 20,328 items
| Maximum | 24 |
| Decile 9 | 6 |
| Decile 8 | 5 |
| Decile 7 | 4 |
| Decile 6 | 4 |
| Median | 3 |
| Decile 4 | 3 |
| Decile 3 | 2 |
| Decile 2 | 2 |
| Decile 1 | 1 |
| Minimum | 0 |
|
|
- There are 21 distinct values.
- Mean = 3.70826
- Std.dev = 2.13976
- 87 items above graph maximum of 11
- 892 items have value -10 (Less than an hour a day)
- 12 items have value -3 (Prefer not to answer)
- 846 items have value -1 (Do not know)
|
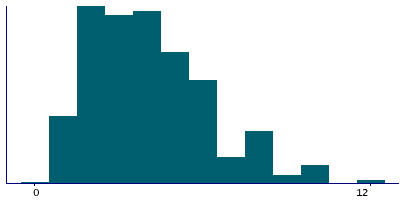
Instance 2 : Imaging visit (2014+)
84,020 participants, 84,020 items
| Maximum | 24 |
| Decile 9 | 7 |
| Decile 8 | 6 |
| Decile 7 | 5 |
| Decile 6 | 4 |
| Median | 4 |
| Decile 4 | 3 |
| Decile 3 | 3 |
| Decile 2 | 2 |
| Decile 1 | 2 |
| Minimum | 0 |
|
|
- There are 20 distinct values.
- Mean = 4.09975
- Std.dev = 2.16778
- 119 items above graph maximum of 12
- 2021 items have value -10 (Less than an hour a day)
- 43 items have value -3 (Prefer not to answer)
- 2446 items have value -1 (Do not know)
|
Instance 3 : First repeat imaging visit (2019+)
8,804 participants, 8,804 items
| Maximum | 24 |
| Decile 9 | 7 |
| Decile 8 | 6 |
| Decile 7 | 5 |
| Decile 6 | 4 |
| Median | 4 |
| Decile 4 | 3 |
| Decile 3 | 3 |
| Decile 2 | 2 |
| Decile 1 | 2 |
| Minimum | 0 |
|
|
- There are 20 distinct values.
- Mean = 4.06546
- Std.dev = 2.13643
- 12 items above graph maximum of 12
- 184 items have value -10 (Less than an hour a day)
- 3 items have value -3 (Prefer not to answer)
- 230 items have value -1 (Do not know)
|
Notes
ACE touchscreen question "In a typical DAY in summer, how many hours do you spend outdoors?"
The following checks were performed:
- If answer < 0 then rejected
- If answer > 24 then rejected
- If answer > 10 then participant asked to confirm
If the participant activated the Help button they were shown the message:
If the time you spend outdoors in summer varies a lot, give the
average time per day. For example if you spend 1 hour a day on each
weekday and 4 hours a day on the weekend, the total hours in a week
is 13 (5 + 8), so you spend approximately 2 hours a day.
|
Coding 100329 defines 3 special values:
- -10 represents "Less than an hour a day"
- -1 represents "Do not know"
- -3 represents "Prefer not to answer"


