Data
2,379,695 items of data are available, covering 67,179 participants.
Defined-instances run from 2 to 3, labelled using Instancing
2.
Array indices run from 0 to 135.
Units of measurement are deciseconds.
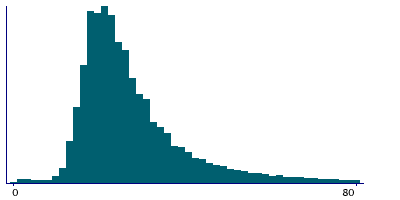
| Maximum | 15977 |
| Decile 9 | 48 |
| Decile 8 | 36 |
| Decile 7 | 31 |
| Decile 6 | 27 |
| Median | 25 |
| Decile 4 | 22 |
| Decile 3 | 20 |
| Decile 2 | 19 |
| Decile 1 | 16 |
| Minimum | 0 |
|
|
- There are 739 distinct values.
- Mean = 30.4894
- Std.dev = 26.5488
- 70856 items above graph maximum of 80
|
2 Instances
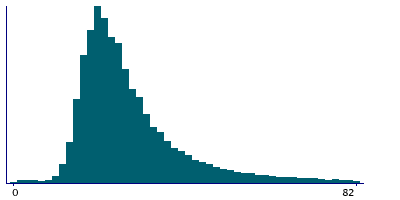
Instance 2 : Imaging visit (2014+)
65,768 participants, 2,103,445 items
| Maximum | 15977 |
| Decile 9 | 49 |
| Decile 8 | 36 |
| Decile 7 | 31 |
| Decile 6 | 27 |
| Median | 25 |
| Decile 4 | 22 |
| Decile 3 | 21 |
| Decile 2 | 19 |
| Decile 1 | 16 |
| Minimum | 0 |
|
|
- There are 727 distinct values.
- Mean = 30.6819
- Std.dev = 27.1274
- 60198 items above graph maximum of 82
|
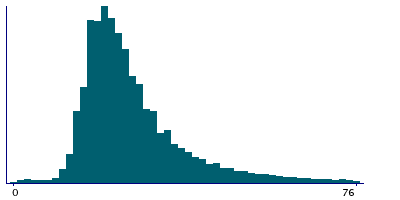
Instance 3 : First repeat imaging visit (2019+)
8,389 participants, 276,250 items
| Maximum | 1253 |
| Decile 9 | 46 |
| Decile 8 | 35 |
| Decile 7 | 29 |
| Decile 6 | 26 |
| Median | 24 |
| Decile 4 | 22 |
| Decile 3 | 20 |
| Decile 2 | 18 |
| Decile 1 | 16 |
| Minimum | 0 |
|
|
- There are 385 distinct values.
- Mean = 29.0234
- Std.dev = 21.5854
- 7854 items above graph maximum of 76
|