Data
136,097 items of data are available, covering 131,908 participants.
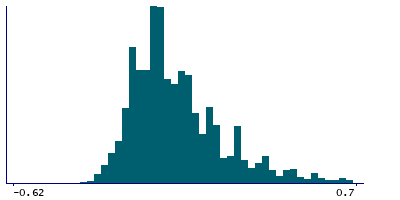
Defined-instances run from 0 to 1, labelled using Instancing
2.
| Maximum | 1.35 |
| Decile 9 | 0.26 |
| Decile 8 | 0.14 |
| Decile 7 | 0.06 |
| Decile 6 | 0.02 |
| Median | -0.04 |
| Decile 4 | -0.06 |
| Decile 3 | -0.1 |
| Decile 2 | -0.14 |
| Decile 1 | -0.18 |
| Minimum | -0.66 |
|
|
- Mean = 0.0234822
- Std.dev = 0.208658
- 1 item below graph minimum of -0.62
- 2153 items above graph maximum of 0.7
|
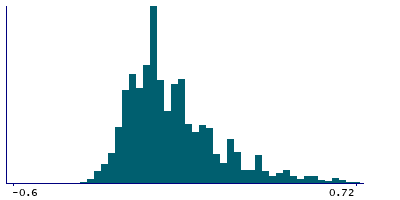
2 Instances
Instance 0 : Initial assessment visit (2006-2010) at which participants were recruited and consent given
115,946 participants, 115,946 items
| Maximum | 1.35 |
| Decile 9 | 0.28 |
| Decile 8 | 0.14 |
| Decile 7 | 0.06 |
| Decile 6 | 0.02 |
| Median | -0.02 |
| Decile 4 | -0.06 |
| Decile 3 | -0.08 |
| Decile 2 | -0.12 |
| Decile 1 | -0.16 |
| Minimum | -0.66 |
|
|
- Mean = 0.0275637
- Std.dev = 0.208033
- 1 item below graph minimum of -0.6
- 1709 items above graph maximum of 0.72
|
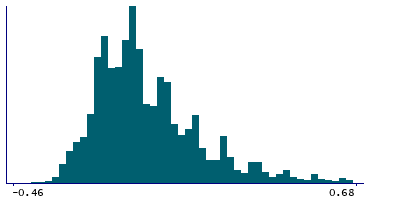
Instance 1 : First repeat assessment visit (2012-13)
20,151 participants, 20,151 items
| Maximum | 1.35 |
| Decile 9 | 0.24 |
| Decile 8 | 0.12 |
| Decile 7 | 0.04 |
| Decile 6 | 0 |
| Median | -0.06 |
| Decile 4 | -0.08 |
| Decile 3 | -0.12 |
| Decile 2 | -0.16 |
| Decile 1 | -0.2 |
| Minimum | -0.46 |
|
|
- Mean = -2.03464e-06
- Std.dev = 0.210688
- 333 items above graph maximum of 0.68
|


