Data
126,303 items of data are available, covering 107,969 participants.
Some values have special meanings defined by Data-Coding
100291.
Defined-instances run from 0 to 3, labelled using Instancing
2.
Units of measurement are years.
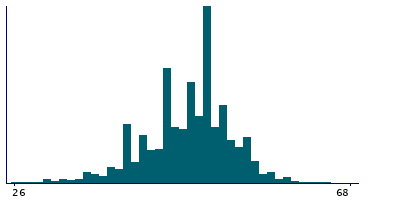
| Maximum | 82 |
| Decile 9 | 54 |
| Decile 8 | 52 |
| Decile 7 | 50 |
| Decile 6 | 50 |
| Median | 48 |
| Decile 4 | 47 |
| Decile 3 | 45 |
| Decile 2 | 43 |
| Decile 1 | 40 |
| Minimum | 16 |
|
|
- There are 64 distinct values.
- Mean = 47.5744
- Std.dev = 5.59844
- 165 items below graph minimum of 26
- 58 items above graph maximum of 68
- 130 items have value -3 (Prefer not to answer)
- 13031 items have value -1 (Do not know)
|
4 Instances
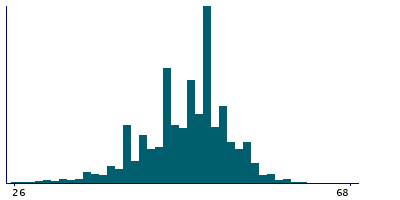
Instance 0 : Initial assessment visit (2006-2010) at which participants were recruited and consent given
103,871 participants, 103,871 items
| Maximum | 70 |
| Decile 9 | 54 |
| Decile 8 | 52 |
| Decile 7 | 50 |
| Decile 6 | 50 |
| Median | 48 |
| Decile 4 | 47 |
| Decile 3 | 45 |
| Decile 2 | 43 |
| Decile 1 | 40 |
| Minimum | 16 |
|
|
- There are 55 distinct values.
- Mean = 47.3775
- Std.dev = 5.44468
- 133 items below graph minimum of 26
- 3 items above graph maximum of 68
- 114 items have value -3 (Prefer not to answer)
- 10574 items have value -1 (Do not know)
|
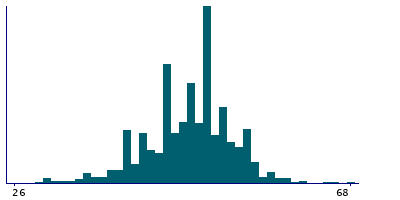
Instance 1 : First repeat assessment visit (2012-13)
4,153 participants, 4,153 items
| Maximum | 68 |
| Decile 9 | 54 |
| Decile 8 | 52 |
| Decile 7 | 50 |
| Decile 6 | 50 |
| Median | 48 |
| Decile 4 | 47 |
| Decile 3 | 45 |
| Decile 2 | 44 |
| Decile 1 | 40 |
| Minimum | 22 |
|
|
- There are 43 distinct values.
- Mean = 47.756
- Std.dev = 5.37477
- 3 items below graph minimum of 26
- 1 items have value -3 (Prefer not to answer)
- 463 items have value -1 (Do not know)
|
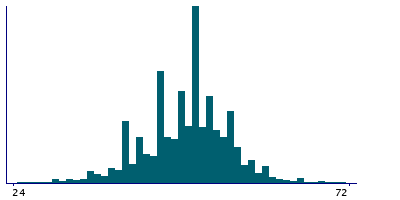
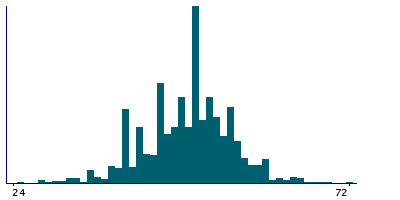
Instance 2 : Imaging visit (2014+)
16,698 participants, 16,698 items
| Maximum | 82 |
| Decile 9 | 56 |
| Decile 8 | 54 |
| Decile 7 | 52 |
| Decile 6 | 50 |
| Median | 50 |
| Decile 4 | 48 |
| Decile 3 | 45 |
| Decile 2 | 44 |
| Decile 1 | 40 |
| Minimum | 16 |
|
|
- There are 63 distinct values.
- Mean = 48.6436
- Std.dev = 6.34348
- 14 items below graph minimum of 24
- 20 items above graph maximum of 72
- 15 items have value -3 (Prefer not to answer)
- 1841 items have value -1 (Do not know)
|
Instance 3 : First repeat imaging visit (2019+)
1,581 participants, 1,581 items
| Maximum | 75 |
| Decile 9 | 56 |
| Decile 8 | 54 |
| Decile 7 | 52 |
| Decile 6 | 50 |
| Median | 50 |
| Decile 4 | 48 |
| Decile 3 | 46 |
| Decile 2 | 44 |
| Decile 1 | 40 |
| Minimum | 16 |
|
|
- There are 46 distinct values.
- Mean = 48.8431
- Std.dev = 6.31707
- 1 item below graph minimum of 24
- 1 item above graph maximum of 72
- 153 items have value -1 (Do not know)
|
Notes
ACE touchscreen question "How old were you when you first used HRT?"
The following checks were performed:
- If answer < 16 then rejected
- If answer > Participants age then rejected
- If answer < 35 then participant asked to confirm
- If answer > 65 then participant asked to confirm
If the participant activated the Help button they were shown the message:
If you are unsure, please provide an estimate or select Do not know.
|
Field 3536 was collected from women who indicated that they had used HRT, as defined by their answers to Field 2814
Coding 100291 defines 2 special values:
- -1 represents "Do not know"
- -3 represents "Prefer not to answer"


