Data
51,610 items of data are available, covering 46,924 participants.
Defined-instances run from 2 to 3, labelled using Instancing
2.
Units of measurement are mm.
| Maximum | 2.659 |
| Decile 9 | 1.896 |
| Decile 8 | 1.83 |
| Decile 7 | 1.783 |
| Decile 6 | 1.742 |
| Median | 1.704 |
| Decile 4 | 1.668 |
| Decile 3 | 1.628 |
| Decile 2 | 1.582 |
| Decile 1 | 1.522 |
| Minimum | 1.18 |
|

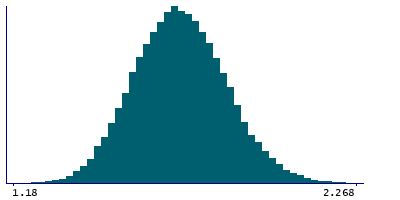
|
- Mean = 1.70802
- Std.dev = 0.146539
- 13 items above graph maximum of 2.27
|
2 Instances
Instance 2 : Imaging visit (2014+)
46,852 participants, 46,852 items
| Maximum | 2.659 |
| Decile 9 | 1.896 |
| Decile 8 | 1.829 |
| Decile 7 | 1.782 |
| Decile 6 | 1.741 |
| Median | 1.704 |
| Decile 4 | 1.667 |
| Decile 3 | 1.627 |
| Decile 2 | 1.581 |
| Decile 1 | 1.521 |
| Minimum | 1.18 |
|
|
- Mean = 1.70735
- Std.dev = 0.146806
- 11 items above graph maximum of 2.271
|
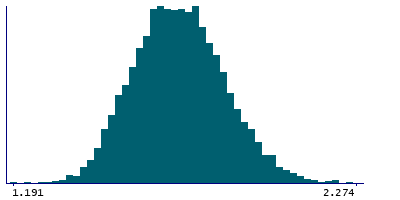
Instance 3 : First repeat imaging visit (2019+)
4,758 participants, 4,758 items
| Maximum | 2.34 |
| Decile 9 | 1.903 |
| Decile 8 | 1.8345 |
| Decile 7 | 1.7865 |
| Decile 6 | 1.749 |
| Median | 1.71 |
| Decile 4 | 1.671 |
| Decile 3 | 1.635 |
| Decile 2 | 1.591 |
| Decile 1 | 1.532 |
| Minimum | 1.191 |
|
|
- Mean = 1.71462
- Std.dev = 0.14372
- 1 item above graph maximum of 2.274
|
Notes
Mean thickness of pericalcarine in the right hemisphere generated by parcellation of the white surface using DKT parcellation
0 Related Data-Fields
There are no related data-fields
0 Resources
There are no matching Resources
