Data
51,610 items of data are available, covering 46,924 participants.
Defined-instances run from 2 to 3, labelled using Instancing
2.
Units of measurement are mm3.
| Maximum | 2211.37 |
| Decile 9 | 1045.35 |
| Decile 8 | 993.613 |
| Decile 7 | 959.139 |
| Decile 6 | 929.722 |
| Median | 903.708 |
| Decile 4 | 877.494 |
| Decile 3 | 850.876 |
| Decile 2 | 821.081 |
| Decile 1 | 780.904 |
| Minimum | 509.96 |
|
|
- Mean = 909.167
- Std.dev = 104.47
- 1 item below graph minimum of 516.458
- 37 items above graph maximum of 1309.8
|
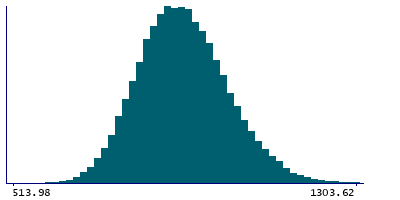
2 Instances
Instance 2 : Imaging visit (2014+)
46,852 participants, 46,852 items
| Maximum | 2211.37 |
| Decile 9 | 1045.78 |
| Decile 8 | 993.955 |
| Decile 7 | 959.391 |
| Decile 6 | 929.697 |
| Median | 903.573 |
| Decile 4 | 877.43 |
| Decile 3 | 850.828 |
| Decile 2 | 820.954 |
| Decile 1 | 780.563 |
| Minimum | 509.96 |
|

|
- Mean = 909.178
- Std.dev = 104.641
- 1 item below graph minimum of 515.352
- 32 items above graph maximum of 1310.99
|
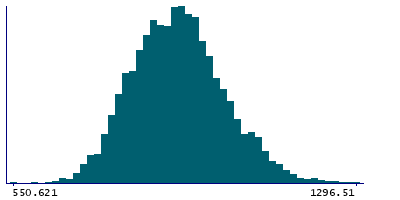
Instance 3 : First repeat imaging visit (2019+)
4,758 participants, 4,758 items
| Maximum | 2194.1 |
| Decile 9 | 1040.07 |
| Decile 8 | 989.197 |
| Decile 7 | 956.665 |
| Decile 6 | 929.799 |
| Median | 905.395 |
| Decile 4 | 878.614 |
| Decile 3 | 851.965 |
| Decile 2 | 822.811 |
| Decile 1 | 783.629 |
| Minimum | 550.621 |
|
|
- Mean = 909.053
- Std.dev = 102.77
- 4 items above graph maximum of 1296.51
|
Notes
Volume of PuM in the left hemisphere generated by subcortical volumetric sub-segmentation of the Thalamic Nuclei
0 Related Data-Fields
There are no related data-fields
0 Resources
There are no matching Resources
