Data
458,243 items of data are available, covering 210,856 participants.
Defined-instances run from 0 to 4, labelled using Instancing
1.
Units of measurement are g.
| Maximum | 12.8983 |
| Decile 9 | 2.21556 |
| Decile 8 | 1.73041 |
| Decile 7 | 1.44035 |
| Decile 6 | 1.22129 |
| Median | 1.03746 |
| Decile 4 | 0.873087 |
| Decile 3 | 0.7138 |
| Decile 2 | 0.548992 |
| Decile 1 | 0.368255 |
| Minimum | 0 |
|

|
- Mean = 1.19849
- Std.dev = 0.798243
- 3378 items above graph maximum of 4.06286
|
5 Instances
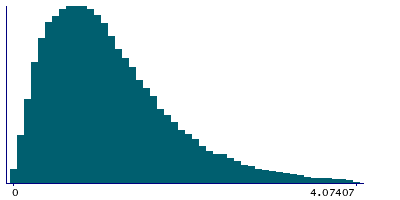
Instance 0 : Conducted in assessment centre, April 2009 to September 2010.
70,655 participants, 70,655 items
| Maximum | 12.8983 |
| Decile 9 | 2.20569 |
| Decile 8 | 1.70856 |
| Decile 7 | 1.41449 |
| Decile 6 | 1.19025 |
| Median | 1.00759 |
| Decile 4 | 0.841738 |
| Decile 3 | 0.680486 |
| Decile 2 | 0.516019 |
| Decile 1 | 0.3373 |
| Minimum | 0 |
|
|
- Mean = 1.17656
- Std.dev = 0.817773
- 584 items above graph maximum of 4.07407
|
Instance 1 : On-line cycle 1, February 2011 to April 2011.
100,519 participants, 100,519 items
| Maximum | 11.6099 |
| Decile 9 | 2.19759 |
| Decile 8 | 1.71669 |
| Decile 7 | 1.43314 |
| Decile 6 | 1.21712 |
| Median | 1.03513 |
| Decile 4 | 0.869928 |
| Decile 3 | 0.712361 |
| Decile 2 | 0.549945 |
| Decile 1 | 0.371396 |
| Minimum | 0 |
|

|
- Mean = 1.19088
- Std.dev = 0.784078
- 697 items above graph maximum of 4.02379
|
Instance 2 : On-line cycle 2, June 2011 to September 2011.
83,201 participants, 83,201 items
| Maximum | 12.8012 |
| Decile 9 | 2.2439 |
| Decile 8 | 1.76011 |
| Decile 7 | 1.46069 |
| Decile 6 | 1.23627 |
| Median | 1.05105 |
| Decile 4 | 0.885868 |
| Decile 3 | 0.726207 |
| Decile 2 | 0.556733 |
| Decile 1 | 0.373308 |
| Minimum | 0 |
|

|
- Mean = 1.2156
- Std.dev = 0.809914
- 600 items above graph maximum of 4.11449
|
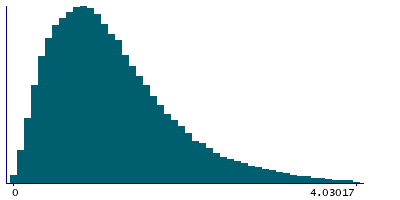
Instance 3 : On-line cycle 3, October 2011 to December 2011.
103,699 participants, 103,699 items
| Maximum | 12.6603 |
| Decile 9 | 2.20199 |
| Decile 8 | 1.72109 |
| Decile 7 | 1.43166 |
| Decile 6 | 1.21653 |
| Median | 1.03452 |
| Decile 4 | 0.874032 |
| Decile 3 | 0.717244 |
| Decile 2 | 0.55365 |
| Decile 1 | 0.373798 |
| Minimum | 0 |
|
|
- Mean = 1.19434
- Std.dev = 0.787399
- 722 items above graph maximum of 4.03017
|
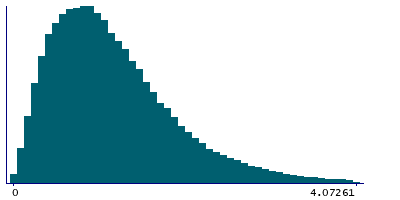
Instance 4 : On-line cycle 4, April 2012 to June 2012.
100,169 participants, 100,169 items
| Maximum | 12.2439 |
| Decile 9 | 2.22526 |
| Decile 8 | 1.74562 |
| Decile 7 | 1.45788 |
| Decile 6 | 1.23934 |
| Median | 1.0538 |
| Decile 4 | 0.887025 |
| Decile 3 | 0.725205 |
| Decile 2 | 0.560794 |
| Decile 1 | 0.377903 |
| Minimum | 0 |
|
|
- Mean = 1.21168
- Std.dev = 0.799251
- 784 items above graph maximum of 4.07261
|
