Data
458,244 items of data are available, covering 210,856 participants.
Defined-instances run from 0 to 4, labelled using Instancing
1.
Units of measurement are g.
| Maximum | 573 |
| Decile 9 | 60 |
| Decile 8 | 60 |
| Decile 7 | 24 |
| Decile 6 | 0 |
| Median | 0 |
| Decile 4 | 0 |
| Decile 3 | 0 |
| Decile 2 | 0 |
| Decile 1 | 0 |
| Minimum | 0 |
|
|
- Mean = 20.9444
- Std.dev = 36.6051
- 11724 items above graph maximum of 120
|
5 Instances
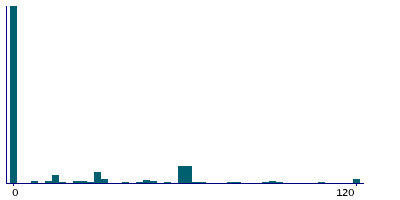
Instance 0 : Conducted in assessment centre, April 2009 to September 2010.
70,655 participants, 70,655 items
| Maximum | 495 |
| Decile 9 | 60 |
| Decile 8 | 60 |
| Decile 7 | 22.5 |
| Decile 6 | 0 |
| Median | 0 |
| Decile 4 | 0 |
| Decile 3 | 0 |
| Decile 2 | 0 |
| Decile 1 | 0 |
| Minimum | 0 |
|
|
- Mean = 20.9995
- Std.dev = 37.1476
- 1797 items above graph maximum of 120
|
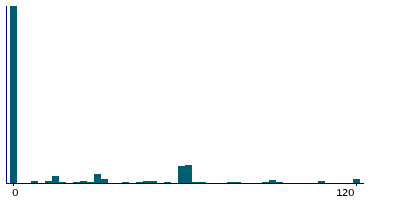
Instance 1 : On-line cycle 1, February 2011 to April 2011.
100,519 participants, 100,519 items
| Maximum | 454 |
| Decile 9 | 60 |
| Decile 8 | 60 |
| Decile 7 | 30 |
| Decile 6 | 0 |
| Median | 0 |
| Decile 4 | 0 |
| Decile 3 | 0 |
| Decile 2 | 0 |
| Decile 1 | 0 |
| Minimum | 0 |
|
|
- Mean = 22.8377
- Std.dev = 38.5656
- 3228 items above graph maximum of 120
|
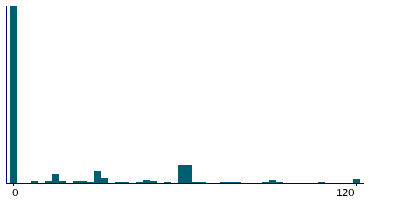
Instance 2 : On-line cycle 2, June 2011 to September 2011.
83,201 participants, 83,201 items
| Maximum | 448 |
| Decile 9 | 60 |
| Decile 8 | 46.25 |
| Decile 7 | 15 |
| Decile 6 | 0 |
| Median | 0 |
| Decile 4 | 0 |
| Decile 3 | 0 |
| Decile 2 | 0 |
| Decile 1 | 0 |
| Minimum | 0 |
|

|
- Mean = 18.4679
- Std.dev = 33.3197
- 1379 items above graph maximum of 120
|
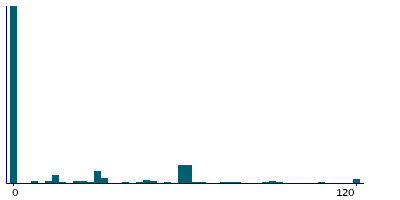
Instance 3 : On-line cycle 3, October 2011 to December 2011.
103,700 participants, 103,700 items
| Maximum | 555 |
| Decile 9 | 60 |
| Decile 8 | 60 |
| Decile 7 | 30 |
| Decile 6 | 0 |
| Median | 0 |
| Decile 4 | 0 |
| Decile 3 | 0 |
| Decile 2 | 0 |
| Decile 1 | 0 |
| Minimum | 0 |
|
|
- Mean = 22.5624
- Std.dev = 38.4116
- 3232 items above graph maximum of 120
|
Instance 4 : On-line cycle 4, April 2012 to June 2012.
100,169 participants, 100,169 items
| Maximum | 573 |
| Decile 9 | 60 |
| Decile 8 | 48 |
| Decile 7 | 15 |
| Decile 6 | 0 |
| Median | 0 |
| Decile 4 | 0 |
| Decile 3 | 0 |
| Decile 2 | 0 |
| Decile 1 | 0 |
| Minimum | 0 |
|

|
- Mean = 19.3875
- Std.dev = 34.6485
- 2088 items above graph maximum of 120
|
