Data
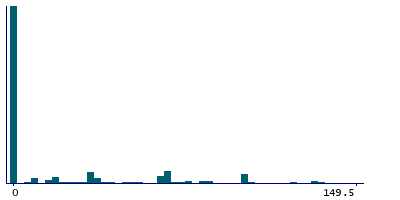
458,244 items of data are available, covering 210,856 participants.
Defined-instances run from 0 to 4, labelled using Instancing
1.
Units of measurement are g.
| Maximum | 363 |
| Decile 9 | 74.75 |
| Decile 8 | 35 |
| Decile 7 | 16.5 |
| Decile 6 | 0 |
| Median | 0 |
| Decile 4 | 0 |
| Decile 3 | 0 |
| Decile 2 | 0 |
| Decile 1 | 0 |
| Minimum | 0 |
|
|
- Mean = 20.6531
- Std.dev = 38.3332
- 5944 items above graph maximum of 149.5
|
5 Instances
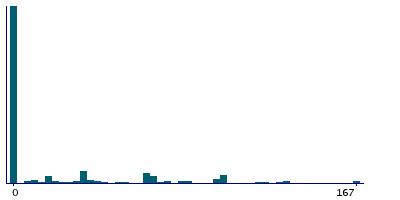
Instance 0 : Conducted in assessment centre, April 2009 to September 2010.
70,655 participants, 70,655 items
| Maximum | 363 |
| Decile 9 | 83.5 |
| Decile 8 | 35 |
| Decile 7 | 16.5 |
| Decile 6 | 0 |
| Median | 0 |
| Decile 4 | 0 |
| Decile 3 | 0 |
| Decile 2 | 0 |
| Decile 1 | 0 |
| Minimum | 0 |
|
|
- Mean = 21.5833
- Std.dev = 40.8001
- 753 items above graph maximum of 167
|
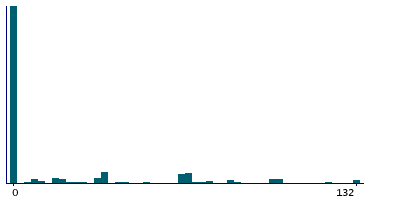
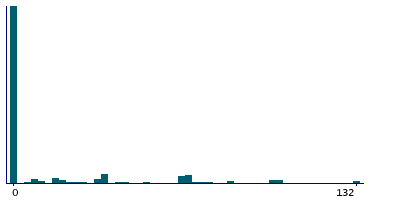
Instance 1 : On-line cycle 1, February 2011 to April 2011.
100,519 participants, 100,519 items
| Maximum | 363 |
| Decile 9 | 66 |
| Decile 8 | 35 |
| Decile 7 | 8.75 |
| Decile 6 | 0 |
| Median | 0 |
| Decile 4 | 0 |
| Decile 3 | 0 |
| Decile 2 | 0 |
| Decile 1 | 0 |
| Minimum | 0 |
|
|
- Mean = 19.5287
- Std.dev = 37.2541
- 1485 items above graph maximum of 132
|
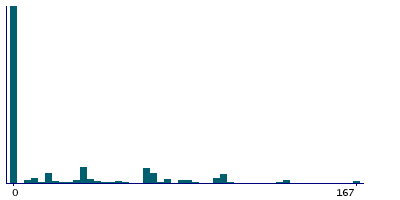
Instance 2 : On-line cycle 2, June 2011 to September 2011.
83,201 participants, 83,201 items
| Maximum | 363 |
| Decile 9 | 83.5 |
| Decile 8 | 66 |
| Decile 7 | 33 |
| Decile 6 | 0 |
| Median | 0 |
| Decile 4 | 0 |
| Decile 3 | 0 |
| Decile 2 | 0 |
| Decile 1 | 0 |
| Minimum | 0 |
|
|
- Mean = 25.3594
- Std.dev = 41.5058
- 801 items above graph maximum of 167
|
Instance 3 : On-line cycle 3, October 2011 to December 2011.
103,700 participants, 103,700 items
| Maximum | 363 |
| Decile 9 | 66 |
| Decile 8 | 33 |
| Decile 7 | 0 |
| Decile 6 | 0 |
| Median | 0 |
| Decile 4 | 0 |
| Decile 3 | 0 |
| Decile 2 | 0 |
| Decile 1 | 0 |
| Minimum | 0 |
|
|
- Mean = 15.2455
- Std.dev = 32.5666
- 964 items above graph maximum of 132
|
Instance 4 : On-line cycle 4, April 2012 to June 2012.
100,169 participants, 100,169 items
| Maximum | 363 |
| Decile 9 | 74.75 |
| Decile 8 | 55 |
| Decile 7 | 20 |
| Decile 6 | 0 |
| Median | 0 |
| Decile 4 | 0 |
| Decile 3 | 0 |
| Decile 2 | 0 |
| Decile 1 | 0 |
| Minimum | 0 |
|

|
- Mean = 22.8143
- Std.dev = 39.6388
- 1420 items above graph maximum of 149.5
|
