Data
458,244 items of data are available, covering 210,856 participants.
Defined-instances run from 0 to 4, labelled using Instancing
1.
Units of measurement are g.
| Maximum | 4500 |
| Decile 9 | 250 |
| Decile 8 | 250 |
| Decile 7 | 125 |
| Decile 6 | 125 |
| Median | 0 |
| Decile 4 | 0 |
| Decile 3 | 0 |
| Decile 2 | 0 |
| Decile 1 | 0 |
| Minimum | 0 |
|

|
- Mean = 106.958
- Std.dev = 161.682
- 5424 items above graph maximum of 500
|
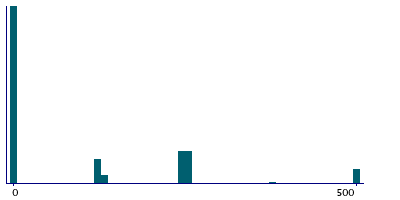
5 Instances
Instance 0 : Conducted in assessment centre, April 2009 to September 2010.
70,655 participants, 70,655 items
| Maximum | 4500 |
| Decile 9 | 250 |
| Decile 8 | 250 |
| Decile 7 | 125 |
| Decile 6 | 0 |
| Median | 0 |
| Decile 4 | 0 |
| Decile 3 | 0 |
| Decile 2 | 0 |
| Decile 1 | 0 |
| Minimum | 0 |
|
|
- Mean = 105.833
- Std.dev = 171.521
- 972 items above graph maximum of 500
|
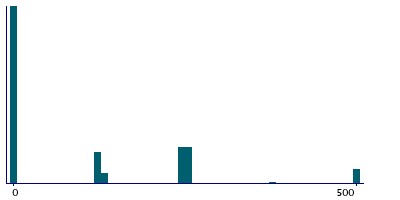
Instance 1 : On-line cycle 1, February 2011 to April 2011.
100,519 participants, 100,519 items
| Maximum | 3750 |
| Decile 9 | 250 |
| Decile 8 | 250 |
| Decile 7 | 125 |
| Decile 6 | 125 |
| Median | 0 |
| Decile 4 | 0 |
| Decile 3 | 0 |
| Decile 2 | 0 |
| Decile 1 | 0 |
| Minimum | 0 |
|
|
- Mean = 109.142
- Std.dev = 160.967
- 1192 items above graph maximum of 500
|
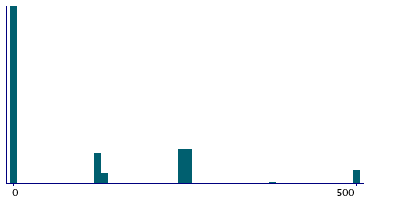
Instance 2 : On-line cycle 2, June 2011 to September 2011.
83,201 participants, 83,201 items
| Maximum | 3000 |
| Decile 9 | 250 |
| Decile 8 | 250 |
| Decile 7 | 125 |
| Decile 6 | 125 |
| Median | 0 |
| Decile 4 | 0 |
| Decile 3 | 0 |
| Decile 2 | 0 |
| Decile 1 | 0 |
| Minimum | 0 |
|

|
- Mean = 110.217
- Std.dev = 163.937
- 1064 items above graph maximum of 500
|
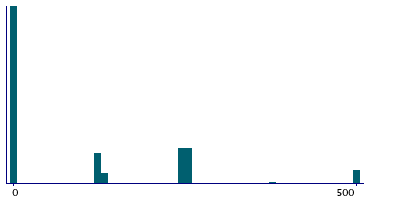
Instance 3 : On-line cycle 3, October 2011 to December 2011.
103,700 participants, 103,700 items
| Maximum | 3250 |
| Decile 9 | 250 |
| Decile 8 | 250 |
| Decile 7 | 125 |
| Decile 6 | 125 |
| Median | 0 |
| Decile 4 | 0 |
| Decile 3 | 0 |
| Decile 2 | 0 |
| Decile 1 | 0 |
| Minimum | 0 |
|
|
- Mean = 104.101
- Std.dev = 156.59
- 1071 items above graph maximum of 500
|
Instance 4 : On-line cycle 4, April 2012 to June 2012.
100,169 participants, 100,169 items
| Maximum | 4500 |
| Decile 9 | 250 |
| Decile 8 | 250 |
| Decile 7 | 125 |
| Decile 6 | 125 |
| Median | 0 |
| Decile 4 | 0 |
| Decile 3 | 0 |
| Decile 2 | 0 |
| Decile 1 | 0 |
| Minimum | 0 |
|
|
- Mean = 105.811
- Std.dev = 158.443
- 1125 items above graph maximum of 500
|
