Data
458,244 items of data are available, covering 210,856 participants.
Defined-instances run from 0 to 4, labelled using Instancing
1.
Units of measurement are g.
| Maximum | 3055 |
| Decile 9 | 143 |
| Decile 8 | 0 |
| Decile 7 | 0 |
| Decile 6 | 0 |
| Median | 0 |
| Decile 4 | 0 |
| Decile 3 | 0 |
| Decile 2 | 0 |
| Decile 1 | 0 |
| Minimum | 0 |
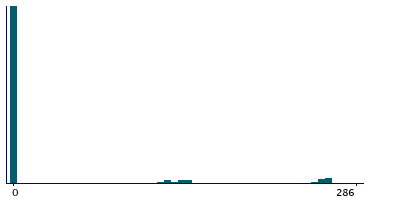
|

|
- Mean = 33.3915
- Std.dev = 108.932
- 8814 items above graph maximum of 286
|
5 Instances
Instance 0 : Conducted in assessment centre, April 2009 to September 2010.
70,655 participants, 70,655 items
| Maximum | 2340 |
| Decile 9 | 143 |
| Decile 8 | 0 |
| Decile 7 | 0 |
| Decile 6 | 0 |
| Median | 0 |
| Decile 4 | 0 |
| Decile 3 | 0 |
| Decile 2 | 0 |
| Decile 1 | 0 |
| Minimum | 0 |
|
|
- Mean = 37.2406
- Std.dev = 119.116
- 1706 items above graph maximum of 286
|
Instance 1 : On-line cycle 1, February 2011 to April 2011.
100,519 participants, 100,519 items
| Maximum | 2086 |
| Decile 9 | 143 |
| Decile 8 | 0 |
| Decile 7 | 0 |
| Decile 6 | 0 |
| Median | 0 |
| Decile 4 | 0 |
| Decile 3 | 0 |
| Decile 2 | 0 |
| Decile 1 | 0 |
| Minimum | 0 |
|

|
- Mean = 34.5574
- Std.dev = 108.112
- 1915 items above graph maximum of 286
|
Instance 2 : On-line cycle 2, June 2011 to September 2011.
83,201 participants, 83,201 items
| Maximum | 3055 |
| Decile 9 | 130 |
| Decile 8 | 0 |
| Decile 7 | 0 |
| Decile 6 | 0 |
| Median | 0 |
| Decile 4 | 0 |
| Decile 3 | 0 |
| Decile 2 | 0 |
| Decile 1 | 0 |
| Minimum | 0 |
|
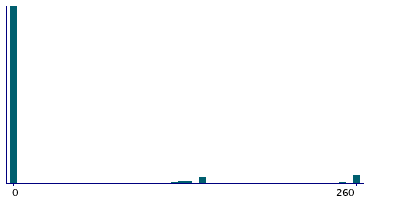
|
- Mean = 31.4441
- Std.dev = 106.794
- 1743 items above graph maximum of 260
|
Instance 3 : On-line cycle 3, October 2011 to December 2011.
103,700 participants, 103,700 items
| Maximum | 2070 |
| Decile 9 | 143 |
| Decile 8 | 0 |
| Decile 7 | 0 |
| Decile 6 | 0 |
| Median | 0 |
| Decile 4 | 0 |
| Decile 3 | 0 |
| Decile 2 | 0 |
| Decile 1 | 0 |
| Minimum | 0 |
|

|
- Mean = 32.9754
- Std.dev = 106.715
- 1900 items above graph maximum of 286
|
Instance 4 : On-line cycle 4, April 2012 to June 2012.
100,169 participants, 100,169 items
| Maximum | 2060 |
| Decile 9 | 143 |
| Decile 8 | 0 |
| Decile 7 | 0 |
| Decile 6 | 0 |
| Median | 0 |
| Decile 4 | 0 |
| Decile 3 | 0 |
| Decile 2 | 0 |
| Decile 1 | 0 |
| Minimum | 0 |
|

|
- Mean = 31.5546
- Std.dev = 106.143
- 1761 items above graph maximum of 286
|
