Data
458,244 items of data are available, covering 210,856 participants.
Defined-instances run from 0 to 4, labelled using Instancing
1.
Units of measurement are g.
| Maximum | 1116 |
| Decile 9 | 96 |
| Decile 8 | 72 |
| Decile 7 | 30 |
| Decile 6 | 0 |
| Median | 0 |
| Decile 4 | 0 |
| Decile 3 | 0 |
| Decile 2 | 0 |
| Decile 1 | 0 |
| Minimum | 0 |
|

|
- Mean = 28.9708
- Std.dev = 53.56
- 6440 items above graph maximum of 192
|
5 Instances
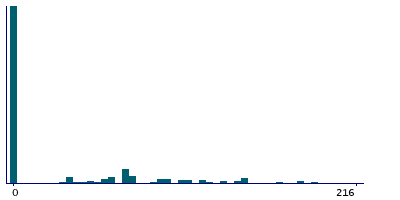
Instance 0 : Conducted in assessment centre, April 2009 to September 2010.
70,655 participants, 70,655 items
| Maximum | 956 |
| Decile 9 | 108 |
| Decile 8 | 72 |
| Decile 7 | 36 |
| Decile 6 | 0 |
| Median | 0 |
| Decile 4 | 0 |
| Decile 3 | 0 |
| Decile 2 | 0 |
| Decile 1 | 0 |
| Minimum | 0 |
|
|
- Mean = 32.8638
- Std.dev = 59.1286
- 1272 items above graph maximum of 216
|
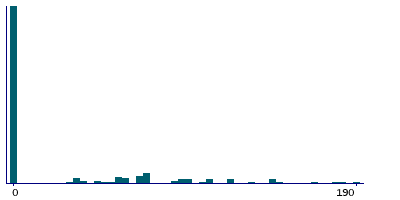
Instance 1 : On-line cycle 1, February 2011 to April 2011.
100,519 participants, 100,519 items
| Maximum | 1116 |
| Decile 9 | 95 |
| Decile 8 | 72 |
| Decile 7 | 0 |
| Decile 6 | 0 |
| Median | 0 |
| Decile 4 | 0 |
| Decile 3 | 0 |
| Decile 2 | 0 |
| Decile 1 | 0 |
| Minimum | 0 |
|
|
- Mean = 27.8819
- Std.dev = 52.0287
- 1431 items above graph maximum of 190
|
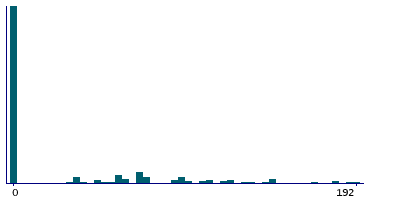
Instance 2 : On-line cycle 2, June 2011 to September 2011.
83,201 participants, 83,201 items
| Maximum | 786 |
| Decile 9 | 96 |
| Decile 8 | 72 |
| Decile 7 | 36 |
| Decile 6 | 0 |
| Median | 0 |
| Decile 4 | 0 |
| Decile 3 | 0 |
| Decile 2 | 0 |
| Decile 1 | 0 |
| Minimum | 0 |
|
|
- Mean = 29.1641
- Std.dev = 53.376
- 1145 items above graph maximum of 192
|
Instance 3 : On-line cycle 3, October 2011 to December 2011.
103,700 participants, 103,700 items
| Maximum | 786 |
| Decile 9 | 95 |
| Decile 8 | 72 |
| Decile 7 | 0 |
| Decile 6 | 0 |
| Median | 0 |
| Decile 4 | 0 |
| Decile 3 | 0 |
| Decile 2 | 0 |
| Decile 1 | 0 |
| Minimum | 0 |
|

|
- Mean = 27.9207
- Std.dev = 51.8397
- 1453 items above graph maximum of 190
|
Instance 4 : On-line cycle 4, April 2012 to June 2012.
100,169 participants, 100,169 items
| Maximum | 786 |
| Decile 9 | 95 |
| Decile 8 | 72 |
| Decile 7 | 18 |
| Decile 6 | 0 |
| Median | 0 |
| Decile 4 | 0 |
| Decile 3 | 0 |
| Decile 2 | 0 |
| Decile 1 | 0 |
| Minimum | 0 |
|

|
- Mean = 28.244
- Std.dev = 52.7142
- 1526 items above graph maximum of 190
|
