Data
458,244 items of data are available, covering 210,856 participants.
Defined-instances run from 0 to 4, labelled using Instancing
1.
Units of measurement are g.
| Maximum | 500 |
| Decile 9 | 0 |
| Decile 8 | 0 |
| Decile 7 | 0 |
| Decile 6 | 0 |
| Median | 0 |
| Decile 4 | 0 |
| Decile 3 | 0 |
| Decile 2 | 0 |
| Decile 1 | 0 |
| Minimum | 0 |
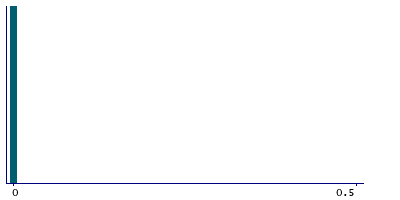
|

|
- Mean = 3.37178
- Std.dev = 21.1615
- 14466 items above graph maximum of 0.5
|
5 Instances
Instance 0 : Conducted in assessment centre, April 2009 to September 2010.
70,655 participants, 70,655 items
| Maximum | 500 |
| Decile 9 | 0 |
| Decile 8 | 0 |
| Decile 7 | 0 |
| Decile 6 | 0 |
| Median | 0 |
| Decile 4 | 0 |
| Decile 3 | 0 |
| Decile 2 | 0 |
| Decile 1 | 0 |
| Minimum | 0 |
|

|
- Mean = 4.38256
- Std.dev = 24.2327
- 2857 items above graph maximum of 0.5
|
Instance 1 : On-line cycle 1, February 2011 to April 2011.
100,519 participants, 100,519 items
| Maximum | 500 |
| Decile 9 | 0 |
| Decile 8 | 0 |
| Decile 7 | 0 |
| Decile 6 | 0 |
| Median | 0 |
| Decile 4 | 0 |
| Decile 3 | 0 |
| Decile 2 | 0 |
| Decile 1 | 0 |
| Minimum | 0 |
|

|
- Mean = 3.08847
- Std.dev = 20.443
- 2874 items above graph maximum of 0.5
|
Instance 2 : On-line cycle 2, June 2011 to September 2011.
83,201 participants, 83,201 items
| Maximum | 500 |
| Decile 9 | 0 |
| Decile 8 | 0 |
| Decile 7 | 0 |
| Decile 6 | 0 |
| Median | 0 |
| Decile 4 | 0 |
| Decile 3 | 0 |
| Decile 2 | 0 |
| Decile 1 | 0 |
| Minimum | 0 |
|

|
- Mean = 3.23794
- Std.dev = 20.6366
- 2557 items above graph maximum of 0.5
|
Instance 3 : On-line cycle 3, October 2011 to December 2011.
103,700 participants, 103,700 items
| Maximum | 500 |
| Decile 9 | 0 |
| Decile 8 | 0 |
| Decile 7 | 0 |
| Decile 6 | 0 |
| Median | 0 |
| Decile 4 | 0 |
| Decile 3 | 0 |
| Decile 2 | 0 |
| Decile 1 | 0 |
| Minimum | 0 |
|

|
- Mean = 3.07811
- Std.dev = 20.1028
- 3029 items above graph maximum of 0.5
|
Instance 4 : On-line cycle 4, April 2012 to June 2012.
100,169 participants, 100,169 items
| Maximum | 500 |
| Decile 9 | 0 |
| Decile 8 | 0 |
| Decile 7 | 0 |
| Decile 6 | 0 |
| Median | 0 |
| Decile 4 | 0 |
| Decile 3 | 0 |
| Decile 2 | 0 |
| Decile 1 | 0 |
| Minimum | 0 |
|
|
- Mean = 3.35832
- Std.dev = 21.0239
- 3149 items above graph maximum of 0.5
|
