Data
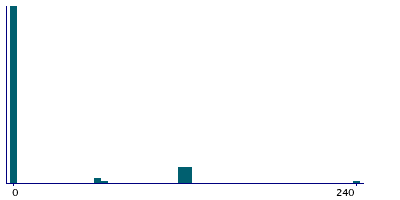
458,244 items of data are available, covering 210,856 participants.
Defined-instances run from 0 to 4, labelled using Instancing
1.
Units of measurement are g.
| Maximum | 600 |
| Decile 9 | 120 |
| Decile 8 | 0 |
| Decile 7 | 0 |
| Decile 6 | 0 |
| Median | 0 |
| Decile 4 | 0 |
| Decile 3 | 0 |
| Decile 2 | 0 |
| Decile 1 | 0 |
| Minimum | 0 |
|
|
- Mean = 22.4655
- Std.dev = 50.4421
- 519 items above graph maximum of 240
|
5 Instances
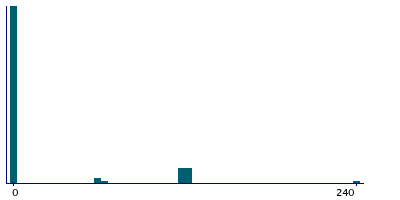
Instance 0 : Conducted in assessment centre, April 2009 to September 2010.
70,655 participants, 70,655 items
| Maximum | 600 |
| Decile 9 | 120 |
| Decile 8 | 0 |
| Decile 7 | 0 |
| Decile 6 | 0 |
| Median | 0 |
| Decile 4 | 0 |
| Decile 3 | 0 |
| Decile 2 | 0 |
| Decile 1 | 0 |
| Minimum | 0 |
|

|
- Mean = 21.6724
- Std.dev = 50.5769
- 97 items above graph maximum of 240
|
Instance 1 : On-line cycle 1, February 2011 to April 2011.
100,519 participants, 100,519 items
| Maximum | 600 |
| Decile 9 | 120 |
| Decile 8 | 0 |
| Decile 7 | 0 |
| Decile 6 | 0 |
| Median | 0 |
| Decile 4 | 0 |
| Decile 3 | 0 |
| Decile 2 | 0 |
| Decile 1 | 0 |
| Minimum | 0 |
|

|
- Mean = 23.3114
- Std.dev = 50.6207
- 89 items above graph maximum of 240
|
Instance 2 : On-line cycle 2, June 2011 to September 2011.
83,201 participants, 83,201 items
| Maximum | 600 |
| Decile 9 | 120 |
| Decile 8 | 0 |
| Decile 7 | 0 |
| Decile 6 | 0 |
| Median | 0 |
| Decile 4 | 0 |
| Decile 3 | 0 |
| Decile 2 | 0 |
| Decile 1 | 0 |
| Minimum | 0 |
|

|
- Mean = 22.0036
- Std.dev = 50.252
- 94 items above graph maximum of 240
|
Instance 3 : On-line cycle 3, October 2011 to December 2011.
103,700 participants, 103,700 items
| Maximum | 600 |
| Decile 9 | 120 |
| Decile 8 | 0 |
| Decile 7 | 0 |
| Decile 6 | 0 |
| Median | 0 |
| Decile 4 | 0 |
| Decile 3 | 0 |
| Decile 2 | 0 |
| Decile 1 | 0 |
| Minimum | 0 |
|

|
- Mean = 23.4145
- Std.dev = 50.9293
- 133 items above graph maximum of 240
|
Instance 4 : On-line cycle 4, April 2012 to June 2012.
100,169 participants, 100,169 items
| Maximum | 600 |
| Decile 9 | 120 |
| Decile 8 | 0 |
| Decile 7 | 0 |
| Decile 6 | 0 |
| Median | 0 |
| Decile 4 | 0 |
| Decile 3 | 0 |
| Decile 2 | 0 |
| Decile 1 | 0 |
| Minimum | 0 |
|
|
- Mean = 21.5773
- Std.dev = 49.7834
- 106 items above graph maximum of 240
|
