Data
458,244 items of data are available, covering 210,856 participants.
Defined-instances run from 0 to 4, labelled using Instancing
1.
Units of measurement are g.
| Maximum | 510.024 |
| Decile 9 | 81.3972 |
| Decile 8 | 65.2343 |
| Decile 7 | 55.4985 |
| Decile 6 | 48.1665 |
| Median | 41.9804 |
| Decile 4 | 36.3646 |
| Decile 3 | 30.9337 |
| Decile 2 | 25.1388 |
| Decile 1 | 18.1018 |
| Minimum | 0 |
|
|
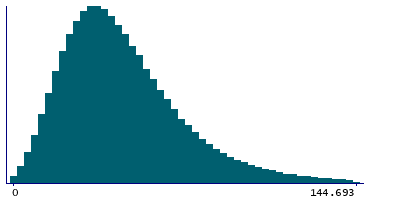
- Mean = 47.0305
- Std.dev = 27.5686
- 3598 items above graph maximum of 144.693
|
5 Instances
Instance 0 : Conducted in assessment centre, April 2009 to September 2010.
70,655 participants, 70,655 items
| Maximum | 510.024 |
| Decile 9 | 84.9634 |
| Decile 8 | 67.1172 |
| Decile 7 | 56.5661 |
| Decile 6 | 48.7436 |
| Median | 42.2063 |
| Decile 4 | 36.2335 |
| Decile 3 | 30.5898 |
| Decile 2 | 24.5695 |
| Decile 1 | 17.3997 |
| Minimum | 0 |
|
|
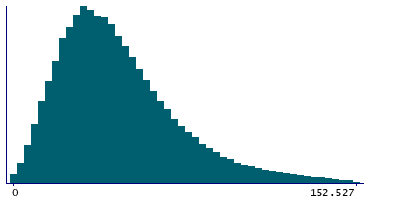
- Mean = 48.0246
- Std.dev = 29.9004
- 613 items above graph maximum of 152.527
|
Instance 1 : On-line cycle 1, February 2011 to April 2011.
100,519 participants, 100,519 items
| Maximum | 367.466 |
| Decile 9 | 81.2205 |
| Decile 8 | 65.3726 |
| Decile 7 | 55.6038 |
| Decile 6 | 48.4376 |
| Median | 42.2538 |
| Decile 4 | 36.6868 |
| Decile 3 | 31.2803 |
| Decile 2 | 25.4989 |
| Decile 1 | 18.4426 |
| Minimum | 0 |
|

|
- Mean = 47.1813
- Std.dev = 27.1841
- 764 items above graph maximum of 143.998
|
Instance 2 : On-line cycle 2, June 2011 to September 2011.
83,201 participants, 83,201 items
| Maximum | 416.06 |
| Decile 9 | 81.4371 |
| Decile 8 | 65.4618 |
| Decile 7 | 55.9896 |
| Decile 6 | 48.6091 |
| Median | 42.4536 |
| Decile 4 | 36.8468 |
| Decile 3 | 31.4106 |
| Decile 2 | 25.5903 |
| Decile 1 | 18.4647 |
| Minimum | 0 |
|
|
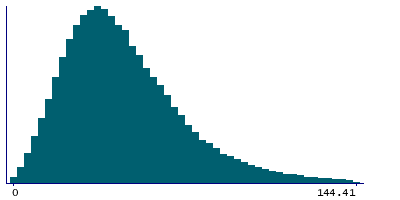
- Mean = 47.3012
- Std.dev = 27.1528
- 602 items above graph maximum of 144.41
|
Instance 3 : On-line cycle 3, October 2011 to December 2011.
103,700 participants, 103,700 items
| Maximum | 467.378 |
| Decile 9 | 79.8828 |
| Decile 8 | 64.0399 |
| Decile 7 | 54.5048 |
| Decile 6 | 47.2426 |
| Median | 41.2109 |
| Decile 4 | 35.7003 |
| Decile 3 | 30.3752 |
| Decile 2 | 24.7648 |
| Decile 1 | 17.8712 |
| Minimum | 0 |
|

|
- Mean = 46.1511
- Std.dev = 26.8974
- 825 items above graph maximum of 141.894
|
Instance 4 : On-line cycle 4, April 2012 to June 2012.
100,169 participants, 100,169 items
| Maximum | 496.249 |
| Decile 9 | 80.6336 |
| Decile 8 | 64.8931 |
| Decile 7 | 55.3288 |
| Decile 6 | 48.0926 |
| Median | 41.9738 |
| Decile 4 | 36.4425 |
| Decile 3 | 31.0373 |
| Decile 2 | 25.2608 |
| Decile 1 | 18.2311 |
| Minimum | 0 |
|
|
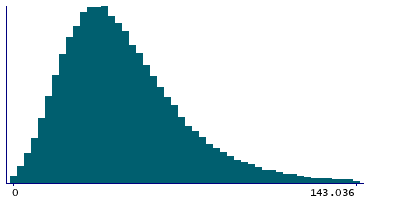
- Mean = 46.8637
- Std.dev = 27.2352
- 772 items above graph maximum of 143.036
|
