Data
458,244 items of data are available, covering 210,856 participants.
Defined-instances run from 0 to 4, labelled using Instancing
1.
Units of measurement are ug.
| Maximum | 773.952 |
| Decile 9 | 89.3987 |
| Decile 8 | 71.1224 |
| Decile 7 | 60.1898 |
| Decile 6 | 52.2216 |
| Median | 45.8321 |
| Decile 4 | 40.5057 |
| Decile 3 | 35.539 |
| Decile 2 | 30.2428 |
| Decile 1 | 23.6113 |
| Minimum | 0 |
|

|
- Mean = 52.3992
- Std.dev = 28.8608
- 3546 items above graph maximum of 155.186
|
5 Instances
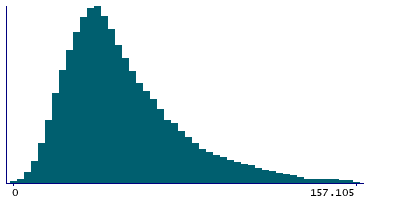
Instance 0 : Conducted in assessment centre, April 2009 to September 2010.
70,655 participants, 70,655 items
| Maximum | 710.311 |
| Decile 9 | 89.6773 |
| Decile 8 | 70.5846 |
| Decile 7 | 59.4459 |
| Decile 6 | 51.2492 |
| Median | 44.8218 |
| Decile 4 | 39.4099 |
| Decile 3 | 34.4005 |
| Decile 2 | 28.9745 |
| Decile 1 | 22.2492 |
| Minimum | 0 |
|
|
- Mean = 51.6749
- Std.dev = 29.9538
- 574 items above graph maximum of 157.105
|
Instance 1 : On-line cycle 1, February 2011 to April 2011.
100,519 participants, 100,519 items
| Maximum | 560.098 |
| Decile 9 | 89.8717 |
| Decile 8 | 71.5246 |
| Decile 7 | 60.4924 |
| Decile 6 | 52.4776 |
| Median | 46.156 |
| Decile 4 | 40.8319 |
| Decile 3 | 35.932 |
| Decile 2 | 30.6729 |
| Decile 1 | 24.1064 |
| Minimum | 0 |
|

|
- Mean = 52.7611
- Std.dev = 28.6675
- 738 items above graph maximum of 155.637
|
Instance 2 : On-line cycle 2, June 2011 to September 2011.
83,201 participants, 83,201 items
| Maximum | 691.131 |
| Decile 9 | 90.4559 |
| Decile 8 | 71.7541 |
| Decile 7 | 60.6941 |
| Decile 6 | 52.7589 |
| Median | 46.2892 |
| Decile 4 | 40.8196 |
| Decile 3 | 35.7894 |
| Decile 2 | 30.4759 |
| Decile 1 | 23.8099 |
| Minimum | 0 |
|

|
- Mean = 52.8909
- Std.dev = 29.2447
- 643 items above graph maximum of 157.102
|
Instance 3 : On-line cycle 3, October 2011 to December 2011.
103,700 participants, 103,700 items
| Maximum | 489.769 |
| Decile 9 | 86.7591 |
| Decile 8 | 69.403 |
| Decile 7 | 58.9923 |
| Decile 6 | 51.2029 |
| Median | 45.0298 |
| Decile 4 | 39.9501 |
| Decile 3 | 35.1949 |
| Decile 2 | 30.0334 |
| Decile 1 | 23.5834 |
| Minimum | 0 |
|

|
- Mean = 51.357
- Std.dev = 27.6966
- 820 items above graph maximum of 149.935
|
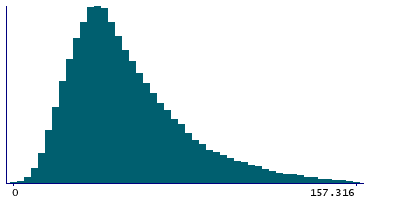
Instance 4 : On-line cycle 4, April 2012 to June 2012.
100,169 participants, 100,169 items
| Maximum | 773.952 |
| Decile 9 | 90.6673 |
| Decile 8 | 72.1636 |
| Decile 7 | 61.2481 |
| Decile 6 | 53.1944 |
| Median | 46.678 |
| Decile 4 | 41.2415 |
| Decile 3 | 36.1224 |
| Decile 2 | 30.749 |
| Decile 1 | 24.0187 |
| Minimum | 0 |
|
|
- Mean = 53.2176
- Std.dev = 29.0845
- 767 items above graph maximum of 157.316
|
