Data
458,244 items of data are available, covering 210,856 participants.
Defined-instances run from 0 to 4, labelled using Instancing
1.
Units of measurement are g.
| Maximum | 59.2221 |
| Decile 9 | 4.85683 |
| Decile 8 | 3.4 |
| Decile 7 | 2.63973 |
| Decile 6 | 1.90729 |
| Median | 1.51125 |
| Decile 4 | 1.20538 |
| Decile 3 | 0.666934 |
| Decile 2 | 0.232024 |
| Decile 1 | 0.048024 |
| Minimum | 0 |
|

|
- Mean = 2.33403
- Std.dev = 3.52161
- 10815 items above graph maximum of 9.66564
|
5 Instances
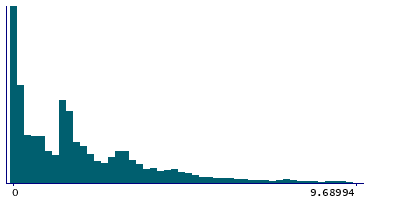
Instance 0 : Conducted in assessment centre, April 2009 to September 2010.
70,655 participants, 70,655 items
| Maximum | 51.0605 |
| Decile 9 | 4.85698 |
| Decile 8 | 3.37742 |
| Decile 7 | 2.6 |
| Decile 6 | 1.82646 |
| Median | 1.45838 |
| Decile 4 | 1.032 |
| Decile 3 | 0.52 |
| Decile 2 | 0.1483 |
| Decile 1 | 0.024012 |
| Minimum | 0 |
|
|
- Mean = 2.27755
- Std.dev = 3.53059
- 1651 items above graph maximum of 9.68994
|
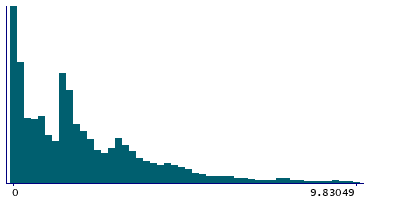
Instance 1 : On-line cycle 1, February 2011 to April 2011.
100,519 participants, 100,519 items
| Maximum | 49.3825 |
| Decile 9 | 4.94525 |
| Decile 8 | 3.48631 |
| Decile 7 | 2.72821 |
| Decile 6 | 1.96351 |
| Median | 1.54858 |
| Decile 4 | 1.287 |
| Decile 3 | 0.721572 |
| Decile 2 | 0.271017 |
| Decile 1 | 0.060012 |
| Minimum | 0 |
|
|
- Mean = 2.37779
- Std.dev = 3.46272
- 2250 items above graph maximum of 9.83049
|
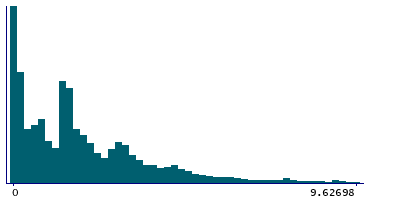
Instance 2 : On-line cycle 2, June 2011 to September 2011.
83,201 participants, 83,201 items
| Maximum | 50.6214 |
| Decile 9 | 4.8375 |
| Decile 8 | 3.36408 |
| Decile 7 | 2.64361 |
| Decile 6 | 1.904 |
| Median | 1.51125 |
| Decile 4 | 1.27429 |
| Decile 3 | 0.6963 |
| Decile 2 | 0.236994 |
| Decile 1 | 0.048024 |
| Minimum | 0 |
|
|
- Mean = 2.3345
- Std.dev = 3.51501
- 1960 items above graph maximum of 9.62698
|
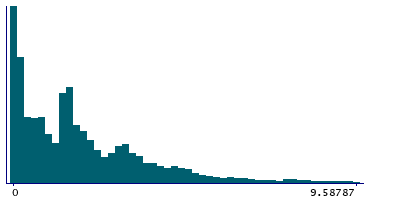
Instance 3 : On-line cycle 3, October 2011 to December 2011.
103,700 participants, 103,700 items
| Maximum | 54.3445 |
| Decile 9 | 4.82144 |
| Decile 8 | 3.4 |
| Decile 7 | 2.5771 |
| Decile 6 | 1.884 |
| Median | 1.50088 |
| Decile 4 | 1.12073 |
| Decile 3 | 0.6375 |
| Decile 2 | 0.239663 |
| Decile 1 | 0.055 |
| Minimum | 0 |
|
|
- Mean = 2.31927
- Std.dev = 3.53759
- 2527 items above graph maximum of 9.58787
|
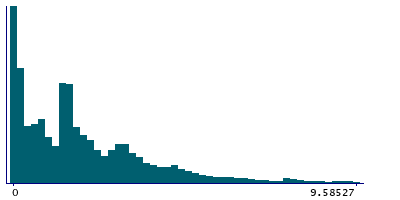
Instance 4 : On-line cycle 4, April 2012 to June 2012.
100,169 participants, 100,169 items
| Maximum | 59.2221 |
| Decile 9 | 4.81676 |
| Decile 8 | 3.38488 |
| Decile 7 | 2.628 |
| Decile 6 | 1.91216 |
| Median | 1.51497 |
| Decile 4 | 1.26901 |
| Decile 3 | 0.703125 |
| Decile 2 | 0.243076 |
| Decile 1 | 0.04825 |
| Minimum | 0 |
|
|
- Mean = 2.34483
- Std.dev = 3.56191
- 2420 items above graph maximum of 9.58527
|
