Data
458,244 items of data are available, covering 210,856 participants.
Defined-instances run from 0 to 4, labelled using Instancing
1.
Units of measurement are g.
| Maximum | 945.283 |
| Decile 9 | 115.459 |
| Decile 8 | 92.2614 |
| Decile 7 | 77.8971 |
| Decile 6 | 66.9453 |
| Median | 57.5297 |
| Decile 4 | 48.9319 |
| Decile 3 | 40.5285 |
| Decile 2 | 31.5932 |
| Decile 1 | 20.8882 |
| Minimum | 0 |
|

|
- Mean = 64.5392
- Std.dev = 40.6666
- 3264 items above graph maximum of 210.031
|
5 Instances
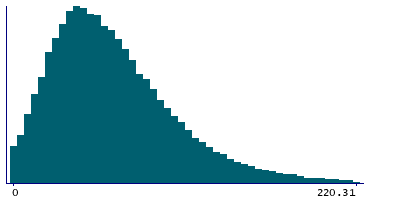
Instance 0 : Conducted in assessment centre, April 2009 to September 2010.
70,655 participants, 70,655 items
| Maximum | 930.255 |
| Decile 9 | 120.096 |
| Decile 8 | 94.8957 |
| Decile 7 | 79.5094 |
| Decile 6 | 67.7722 |
| Median | 57.6467 |
| Decile 4 | 48.4638 |
| Decile 3 | 39.7536 |
| Decile 2 | 30.7993 |
| Decile 1 | 19.8821 |
| Minimum | 0 |
|
|
- Mean = 65.697
- Std.dev = 43.7377
- 521 items above graph maximum of 220.31
|
Instance 1 : On-line cycle 1, February 2011 to April 2011.
100,519 participants, 100,519 items
| Maximum | 493.986 |
| Decile 9 | 114.501 |
| Decile 8 | 91.8897 |
| Decile 7 | 77.6442 |
| Decile 6 | 66.7588 |
| Median | 57.4676 |
| Decile 4 | 49.0541 |
| Decile 3 | 40.752 |
| Decile 2 | 31.7883 |
| Decile 1 | 21.0764 |
| Minimum | 0 |
|

|
- Mean = 64.2822
- Std.dev = 39.8529
- 670 items above graph maximum of 207.926
|
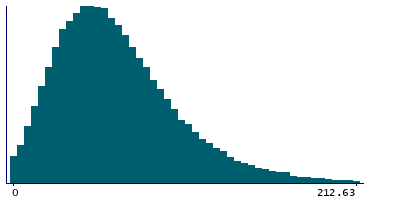
Instance 2 : On-line cycle 2, June 2011 to September 2011.
83,201 participants, 83,201 items
| Maximum | 738.784 |
| Decile 9 | 117.127 |
| Decile 8 | 93.4783 |
| Decile 7 | 79.1472 |
| Decile 6 | 68.064 |
| Median | 58.5978 |
| Decile 4 | 50.0195 |
| Decile 3 | 41.5321 |
| Decile 2 | 32.3929 |
| Decile 1 | 21.6241 |
| Minimum | 0 |
|
|
- Mean = 65.5808
- Std.dev = 40.7256
- 581 items above graph maximum of 212.63
|
Instance 3 : On-line cycle 3, October 2011 to December 2011.
103,700 participants, 103,700 items
| Maximum | 580.124 |
| Decile 9 | 112.529 |
| Decile 8 | 90.1237 |
| Decile 7 | 75.9898 |
| Decile 6 | 65.4114 |
| Median | 56.2963 |
| Decile 4 | 47.8725 |
| Decile 3 | 39.6708 |
| Decile 2 | 30.9506 |
| Decile 1 | 20.4659 |
| Minimum | 0 |
|

|
- Mean = 63.0103
- Std.dev = 39.4334
- 737 items above graph maximum of 204.591
|
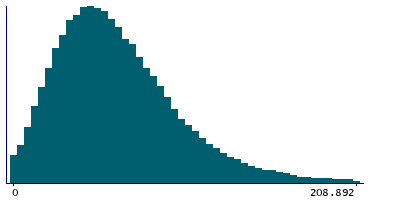
Instance 4 : On-line cycle 4, April 2012 to June 2012.
100,169 participants, 100,169 items
| Maximum | 945.283 |
| Decile 9 | 115.105 |
| Decile 8 | 92.0776 |
| Decile 7 | 78.0699 |
| Decile 6 | 67.259 |
| Median | 57.9087 |
| Decile 4 | 49.3307 |
| Decile 3 | 40.9655 |
| Decile 2 | 32.0174 |
| Decile 1 | 21.3182 |
| Minimum | 0 |
|
|
- Mean = 64.6982
- Std.dev = 40.3806
- 707 items above graph maximum of 208.892
|
