Data
458,244 items of data are available, covering 210,856 participants.
Defined-instances run from 0 to 4, labelled using Instancing
1.
Units of measurement are mg.
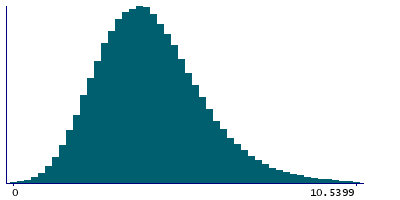
| Maximum | 41.2519 |
| Decile 9 | 6.41013 |
| Decile 8 | 5.52143 |
| Decile 7 | 4.94445 |
| Decile 6 | 4.48517 |
| Median | 4.07934 |
| Decile 4 | 3.69028 |
| Decile 3 | 3.29049 |
| Decile 2 | 2.84789 |
| Decile 1 | 2.28039 |
| Minimum | 0 |
|
|
- Mean = 4.25301
- Std.dev = 1.689
- 1560 items above graph maximum of 10.5399
|
5 Instances
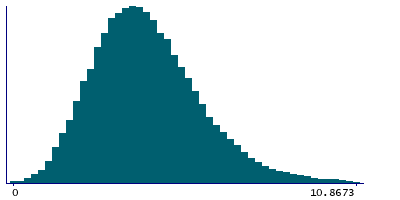
Instance 0 : Conducted in assessment centre, April 2009 to September 2010.
70,655 participants, 70,655 items
| Maximum | 41.2519 |
| Decile 9 | 6.53392 |
| Decile 8 | 5.58427 |
| Decile 7 | 4.97458 |
| Decile 6 | 4.49435 |
| Median | 4.06775 |
| Decile 4 | 3.66074 |
| Decile 3 | 3.24372 |
| Decile 2 | 2.79335 |
| Decile 1 | 2.20051 |
| Minimum | 0 |
|
|
- Mean = 4.26373
- Std.dev = 1.78356
- 266 items above graph maximum of 10.8673
|
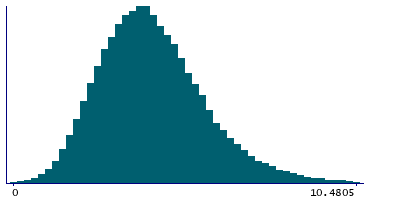
Instance 1 : On-line cycle 1, February 2011 to April 2011.
100,519 participants, 100,519 items
| Maximum | 20.9015 |
| Decile 9 | 6.39677 |
| Decile 8 | 5.51413 |
| Decile 7 | 4.94576 |
| Decile 6 | 4.49181 |
| Median | 4.08932 |
| Decile 4 | 3.71184 |
| Decile 3 | 3.31505 |
| Decile 2 | 2.87485 |
| Decile 1 | 2.31308 |
| Minimum | 0 |
|
|
- Mean = 4.26389
- Std.dev = 1.66934
- 319 items above graph maximum of 10.4805
|
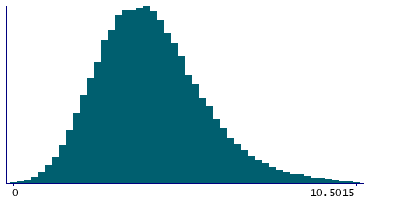
Instance 2 : On-line cycle 2, June 2011 to September 2011.
83,201 participants, 83,201 items
| Maximum | 26.7985 |
| Decile 9 | 6.38382 |
| Decile 8 | 5.50318 |
| Decile 7 | 4.92639 |
| Decile 6 | 4.47065 |
| Median | 4.07151 |
| Decile 4 | 3.67429 |
| Decile 3 | 3.27672 |
| Decile 2 | 2.83672 |
| Decile 1 | 2.26613 |
| Minimum | 0 |
|
|
- Mean = 4.23648
- Std.dev = 1.68058
- 293 items above graph maximum of 10.5015
|
Instance 3 : On-line cycle 3, October 2011 to December 2011.
103,700 participants, 103,700 items
| Maximum | 25.4419 |
| Decile 9 | 6.3591 |
| Decile 8 | 5.47996 |
| Decile 7 | 4.92136 |
| Decile 6 | 4.4663 |
| Median | 4.06418 |
| Decile 4 | 3.6823 |
| Decile 3 | 3.28871 |
| Decile 2 | 2.84721 |
| Decile 1 | 2.29196 |
| Minimum | 0 |
|

|
- Mean = 4.23319
- Std.dev = 1.65527
- 314 items above graph maximum of 10.4262
|
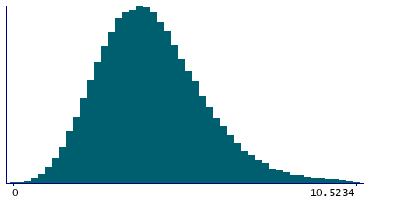
Instance 4 : On-line cycle 4, April 2012 to June 2012.
100,169 participants, 100,169 items
| Maximum | 35.1368 |
| Decile 9 | 6.41425 |
| Decile 8 | 5.53893 |
| Decile 7 | 4.96046 |
| Decile 6 | 4.5047 |
| Median | 4.0998 |
| Decile 4 | 3.71189 |
| Decile 3 | 3.30813 |
| Decile 2 | 2.87003 |
| Decile 1 | 2.30507 |
| Minimum | 0 |
|
|
- Mean = 4.26876
- Std.dev = 1.68124
- 348 items above graph maximum of 10.5234
|
