Data
458,244 items of data are available, covering 210,856 participants.
Defined-instances run from 0 to 4, labelled using Instancing
1.
Units of measurement are g.
| Maximum | 539.499 |
| Decile 9 | 98.1216 |
| Decile 8 | 82.1789 |
| Decile 7 | 71.9645 |
| Decile 6 | 63.8186 |
| Median | 56.5365 |
| Decile 4 | 49.5566 |
| Decile 3 | 42.4899 |
| Decile 2 | 34.7443 |
| Decile 1 | 25.446 |
| Minimum | 0 |
|

|
- Mean = 60.1158
- Std.dev = 29.9399
- 2003 items above graph maximum of 170.797
|
5 Instances
Instance 0 : Conducted in assessment centre, April 2009 to September 2010.
70,655 participants, 70,655 items
| Maximum | 513.983 |
| Decile 9 | 101.657 |
| Decile 8 | 84.5078 |
| Decile 7 | 73.7098 |
| Decile 6 | 65.3022 |
| Median | 57.6263 |
| Decile 4 | 50.4534 |
| Decile 3 | 43.0293 |
| Decile 2 | 34.7957 |
| Decile 1 | 24.9001 |
| Minimum | 0 |
|

|
- Mean = 61.4881
- Std.dev = 31.6859
- 316 items above graph maximum of 178.414
|
Instance 1 : On-line cycle 1, February 2011 to April 2011.
100,519 participants, 100,519 items
| Maximum | 385.212 |
| Decile 9 | 99.4318 |
| Decile 8 | 83.2445 |
| Decile 7 | 72.9414 |
| Decile 6 | 64.7565 |
| Median | 57.4221 |
| Decile 4 | 50.4047 |
| Decile 3 | 43.2213 |
| Decile 2 | 35.3968 |
| Decile 1 | 25.9264 |
| Minimum | 0 |
|

|
- Mean = 60.9411
- Std.dev = 30.0097
- 423 items above graph maximum of 172.937
|
Instance 2 : On-line cycle 2, June 2011 to September 2011.
83,201 participants, 83,201 items
| Maximum | 519.832 |
| Decile 9 | 97.1316 |
| Decile 8 | 81.5467 |
| Decile 7 | 71.292 |
| Decile 6 | 63.0829 |
| Median | 55.8614 |
| Decile 4 | 49.0093 |
| Decile 3 | 42.0932 |
| Decile 2 | 34.464 |
| Decile 1 | 25.4464 |
| Minimum | 0 |
|

|
- Mean = 59.5812
- Std.dev = 29.7378
- 383 items above graph maximum of 168.817
|
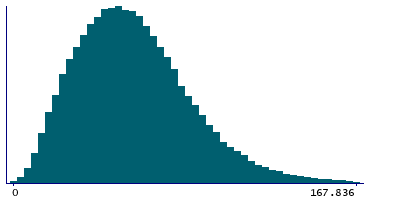
Instance 3 : On-line cycle 3, October 2011 to December 2011.
103,700 participants, 103,700 items
| Maximum | 413.779 |
| Decile 9 | 96.5261 |
| Decile 8 | 80.9919 |
| Decile 7 | 71.1121 |
| Decile 6 | 63.077 |
| Median | 55.9515 |
| Decile 4 | 49.0048 |
| Decile 3 | 42.0265 |
| Decile 2 | 34.4056 |
| Decile 1 | 25.2166 |
| Minimum | 0 |
|
|
- Mean = 59.2965
- Std.dev = 29.1975
- 431 items above graph maximum of 167.836
|
Instance 4 : On-line cycle 4, April 2012 to June 2012.
100,169 participants, 100,169 items
| Maximum | 539.499 |
| Decile 9 | 96.872 |
| Decile 8 | 81.3125 |
| Decile 7 | 71.2166 |
| Decile 6 | 63.2141 |
| Median | 56.0838 |
| Decile 4 | 49.2432 |
| Decile 3 | 42.2493 |
| Decile 2 | 34.6336 |
| Decile 1 | 25.6159 |
| Minimum | 0 |
|

|
- Mean = 59.6117
- Std.dev = 29.4717
- 448 items above graph maximum of 168.128
|
