Data
458,244 items of data are available, covering 210,856 participants.
Defined-instances run from 0 to 4, labelled using Instancing
1.
Units of measurement are g.
| Maximum | 76.9676 |
| Decile 9 | 13.8994 |
| Decile 8 | 8.60843 |
| Decile 7 | 6.49632 |
| Decile 6 | 5.27951 |
| Median | 4.38615 |
| Decile 4 | 3.61761 |
| Decile 3 | 2.92093 |
| Decile 2 | 2.24547 |
| Decile 1 | 1.29065 |
| Minimum | 0 |
|
|
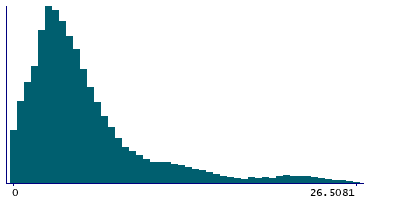
- Mean = 6.64823
- Std.dev = 7.65206
- 14713 items above graph maximum of 26.5081
|
5 Instances
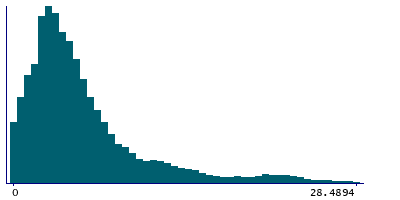
Instance 0 : Conducted in assessment centre, April 2009 to September 2010.
70,655 participants, 70,655 items
| Maximum | 76.9676 |
| Decile 9 | 14.8781 |
| Decile 8 | 9.17277 |
| Decile 7 | 6.80416 |
| Decile 6 | 5.47655 |
| Median | 4.52537 |
| Decile 4 | 3.68737 |
| Decile 3 | 2.95986 |
| Decile 2 | 2.265 |
| Decile 1 | 1.2668 |
| Minimum | 0 |
|
|
- Mean = 7.01787
- Std.dev = 8.25365
- 2480 items above graph maximum of 28.4894
|
Instance 1 : On-line cycle 1, February 2011 to April 2011.
100,519 participants, 100,519 items
| Maximum | 74.5402 |
| Decile 9 | 13.5036 |
| Decile 8 | 8.38837 |
| Decile 7 | 6.40562 |
| Decile 6 | 5.23972 |
| Median | 4.36739 |
| Decile 4 | 3.61209 |
| Decile 3 | 2.921 |
| Decile 2 | 2.25806 |
| Decile 1 | 1.29875 |
| Minimum | 0 |
|

|
- Mean = 6.52327
- Std.dev = 7.43737
- 3154 items above graph maximum of 25.7084
|
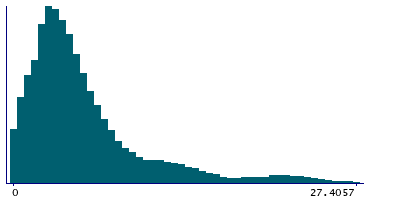
Instance 2 : On-line cycle 2, June 2011 to September 2011.
83,201 participants, 83,201 items
| Maximum | 75.5109 |
| Decile 9 | 14.3462 |
| Decile 8 | 8.93086 |
| Decile 7 | 6.63142 |
| Decile 6 | 5.36262 |
| Median | 4.43362 |
| Decile 4 | 3.65853 |
| Decile 3 | 2.94336 |
| Decile 2 | 2.24547 |
| Decile 1 | 1.28675 |
| Minimum | 0 |
|
|
- Mean = 6.8069
- Std.dev = 7.84905
- 2770 items above graph maximum of 27.4057
|
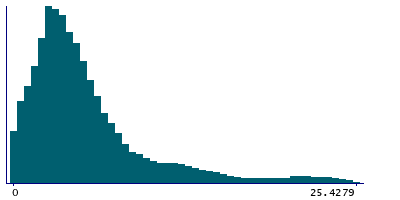
Instance 3 : On-line cycle 3, October 2011 to December 2011.
103,700 participants, 103,700 items
| Maximum | 70.5996 |
| Decile 9 | 13.3567 |
| Decile 8 | 8.26132 |
| Decile 7 | 6.29395 |
| Decile 6 | 5.15089 |
| Median | 4.3049 |
| Decile 4 | 3.5568 |
| Decile 3 | 2.88372 |
| Decile 2 | 2.21787 |
| Decile 1 | 1.28548 |
| Minimum | 0 |
|
|
- Mean = 6.43483
- Std.dev = 7.37343
- 3188 items above graph maximum of 25.4279
|
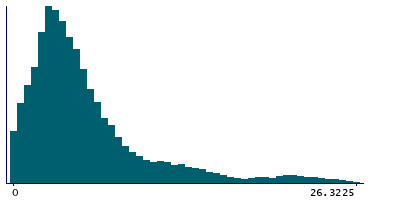
Instance 4 : On-line cycle 4, April 2012 to June 2012.
100,169 participants, 100,169 items
| Maximum | 75.89 |
| Decile 9 | 13.8135 |
| Decile 8 | 8.58327 |
| Decile 7 | 6.48884 |
| Decile 6 | 5.26154 |
| Median | 4.37237 |
| Decile 4 | 3.60242 |
| Decile 3 | 2.91784 |
| Decile 2 | 2.25219 |
| Decile 1 | 1.30457 |
| Minimum | 0 |
|
|
- Mean = 6.602
- Std.dev = 7.52802
- 3108 items above graph maximum of 26.3225
|
