Data
458,244 items of data are available, covering 210,856 participants.
Defined-instances run from 0 to 4, labelled using Instancing
1.
Units of measurement are g.
| Maximum | 151.923 |
| Decile 9 | 24.6614 |
| Decile 8 | 20.032 |
| Decile 7 | 17.1174 |
| Decile 6 | 14.8195 |
| Median | 12.8508 |
| Decile 4 | 10.9454 |
| Decile 3 | 8.97849 |
| Decile 2 | 6.801 |
| Decile 1 | 4.03125 |
| Minimum | 0 |
|
|
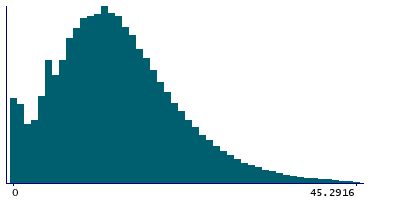
- Mean = 13.8478
- Std.dev = 8.518
- 2108 items above graph maximum of 45.2916
|
5 Instances
Instance 0 : Conducted in assessment centre, April 2009 to September 2010.
70,655 participants, 70,655 items
| Maximum | 125.037 |
| Decile 9 | 24.8616 |
| Decile 8 | 20.1322 |
| Decile 7 | 17.1938 |
| Decile 6 | 14.9141 |
| Median | 12.9475 |
| Decile 4 | 10.9938 |
| Decile 3 | 9.03067 |
| Decile 2 | 6.87651 |
| Decile 1 | 4.03125 |
| Minimum | 0 |
|

|
- Mean = 13.96
- Std.dev = 8.72607
- 379 items above graph maximum of 45.692
|
Instance 1 : On-line cycle 1, February 2011 to April 2011.
100,519 participants, 100,519 items
| Maximum | 130.624 |
| Decile 9 | 24.966 |
| Decile 8 | 20.3425 |
| Decile 7 | 17.3607 |
| Decile 6 | 15.0445 |
| Median | 13.0623 |
| Decile 4 | 11.1427 |
| Decile 3 | 9.1136 |
| Decile 2 | 6.94738 |
| Decile 1 | 4.13378 |
| Minimum | 0 |
|
|
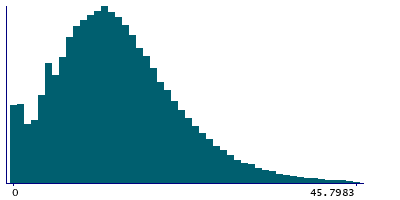
- Mean = 14.0636
- Std.dev = 8.58536
- 450 items above graph maximum of 45.7983
|
Instance 2 : On-line cycle 2, June 2011 to September 2011.
83,201 participants, 83,201 items
| Maximum | 145.547 |
| Decile 9 | 24.0504 |
| Decile 8 | 19.4768 |
| Decile 7 | 16.6095 |
| Decile 6 | 14.3532 |
| Median | 12.4376 |
| Decile 4 | 10.596 |
| Decile 3 | 8.72151 |
| Decile 2 | 6.57185 |
| Decile 1 | 3.84614 |
| Minimum | 0 |
|

|
- Mean = 13.4513
- Std.dev = 8.32766
- 385 items above graph maximum of 44.2546
|
Instance 3 : On-line cycle 3, October 2011 to December 2011.
103,700 participants, 103,700 items
| Maximum | 151.923 |
| Decile 9 | 24.694 |
| Decile 8 | 20.0869 |
| Decile 7 | 17.153 |
| Decile 6 | 14.8473 |
| Median | 12.8695 |
| Decile 4 | 10.9752 |
| Decile 3 | 8.9727 |
| Decile 2 | 6.7415 |
| Decile 1 | 4.03125 |
| Minimum | 0 |
|
|
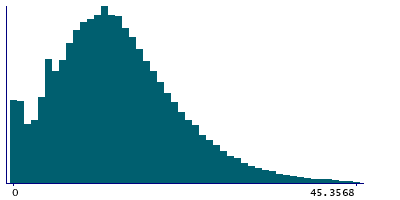
- Mean = 13.8542
- Std.dev = 8.4905
- 446 items above graph maximum of 45.3568
|
Instance 4 : On-line cycle 4, April 2012 to June 2012.
100,169 participants, 100,169 items
| Maximum | 101.988 |
| Decile 9 | 24.6473 |
| Decile 8 | 20.051 |
| Decile 7 | 17.166 |
| Decile 6 | 14.8632 |
| Median | 12.9015 |
| Decile 4 | 10.9926 |
| Decile 3 | 9.007 |
| Decile 2 | 6.84198 |
| Decile 1 | 4.0629 |
| Minimum | 0 |
|
|
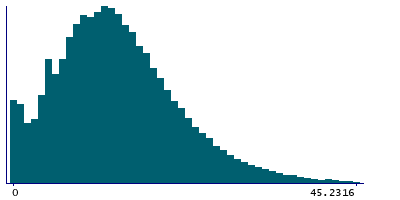
- Mean = 13.8748
- Std.dev = 8.47525
- 453 items above graph maximum of 45.2316
|
