Data
458,244 items of data are available, covering 210,856 participants.
Defined-instances run from 0 to 4, labelled using Instancing
1.
Units of measurement are mg.
| Maximum | 16.821 |
| Decile 9 | 1.29527 |
| Decile 8 | 1.074 |
| Decile 7 | 0.77 |
| Decile 6 | 0.53 |
| Median | 0.42255 |
| Decile 4 | 0.338 |
| Decile 3 | 0.276 |
| Decile 2 | 0.138 |
| Decile 1 | 0 |
| Minimum | 0 |
|
|
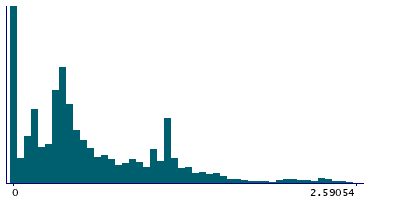
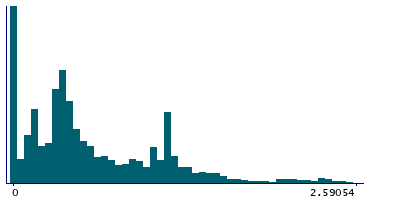
- Mean = 0.608102
- Std.dev = 0.601505
- 4750 items above graph maximum of 2.59054
|
5 Instances
Instance 0 : Conducted in assessment centre, April 2009 to September 2010.
70,655 participants, 70,655 items
| Maximum | 10.15 |
| Decile 9 | 1.24391 |
| Decile 8 | 1.05 |
| Decile 7 | 0.742 |
| Decile 6 | 0.506 |
| Median | 0.39 |
| Decile 4 | 0.338 |
| Decile 3 | 0.245272 |
| Decile 2 | 0.12 |
| Decile 1 | 0 |
| Minimum | 0 |
|
|
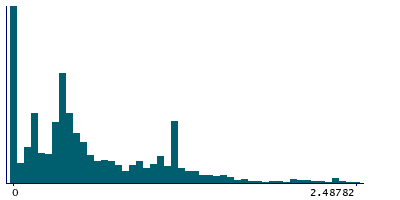
- Mean = 0.586779
- Std.dev = 0.597908
- 792 items above graph maximum of 2.48782
|
Instance 1 : On-line cycle 1, February 2011 to April 2011.
100,519 participants, 100,519 items
| Maximum | 11.2 |
| Decile 9 | 1.308 |
| Decile 8 | 1.11 |
| Decile 7 | 0.808 |
| Decile 6 | 0.554 |
| Median | 0.4275 |
| Decile 4 | 0.338 |
| Decile 3 | 0.285 |
| Decile 2 | 0.1425 |
| Decile 1 | 0 |
| Minimum | 0 |
|
|
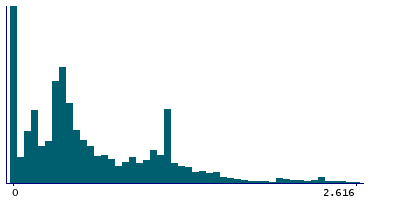
- Mean = 0.617825
- Std.dev = 0.60225
- 986 items above graph maximum of 2.616
|
Instance 2 : On-line cycle 2, June 2011 to September 2011.
83,201 participants, 83,201 items
| Maximum | 12.3496 |
| Decile 9 | 1.308 |
| Decile 8 | 1.05002 |
| Decile 7 | 0.76 |
| Decile 6 | 0.53 |
| Median | 0.423 |
| Decile 4 | 0.338 |
| Decile 3 | 0.2805 |
| Decile 2 | 0.1425 |
| Decile 1 | 0 |
| Minimum | 0 |
|
|
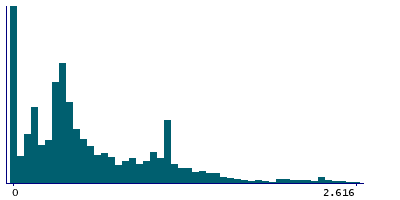
- Mean = 0.611891
- Std.dev = 0.60969
- 866 items above graph maximum of 2.616
|
Instance 3 : On-line cycle 3, October 2011 to December 2011.
103,700 participants, 103,700 items
| Maximum | 11.6386 |
| Decile 9 | 1.29527 |
| Decile 8 | 1.11 |
| Decile 7 | 0.79992 |
| Decile 6 | 0.550136 |
| Median | 0.4275 |
| Decile 4 | 0.338 |
| Decile 3 | 0.285 |
| Decile 2 | 0.1425 |
| Decile 1 | 0 |
| Minimum | 0 |
|
|
- Mean = 0.61465
- Std.dev = 0.600491
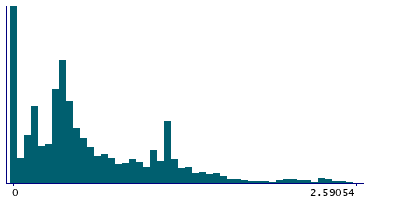
- 1078 items above graph maximum of 2.59054
|
Instance 4 : On-line cycle 4, April 2012 to June 2012.
100,169 participants, 100,169 items
| Maximum | 16.821 |
| Decile 9 | 1.29527 |
| Decile 8 | 1.05 |
| Decile 7 | 0.7575 |
| Decile 6 | 0.52502 |
| Median | 0.414736 |
| Decile 4 | 0.338 |
| Decile 3 | 0.280289 |
| Decile 2 | 0.1425 |
| Decile 1 | 0 |
| Minimum | 0 |
|
|
- Mean = 0.60346
- Std.dev = 0.597062
- 1025 items above graph maximum of 2.59054
|
