Data
458,244 items of data are available, covering 210,856 participants.
Defined-instances run from 0 to 4, labelled using Instancing
1.
Units of measurement are mg.
| Maximum | 15.9568 |
| Decile 9 | 2.06307 |
| Decile 8 | 1.73926 |
| Decile 7 | 1.5528 |
| Decile 6 | 1.4136 |
| Median | 1.29423 |
| Decile 4 | 1.18326 |
| Decile 3 | 1.07227 |
| Decile 2 | 0.951464 |
| Decile 1 | 0.794998 |
| Minimum | 0 |
|

|
- Mean = 1.39498
- Std.dev = 0.611743
- 6991 items above graph maximum of 3.33115
|
5 Instances
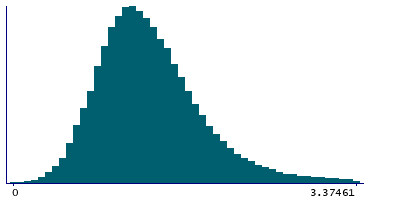
Instance 0 : Conducted in assessment centre, April 2009 to September 2010.
70,655 participants, 70,655 items
| Maximum | 15.602 |
| Decile 9 | 2.06961 |
| Decile 8 | 1.74401 |
| Decile 7 | 1.556 |
| Decile 6 | 1.41002 |
| Median | 1.28513 |
| Decile 4 | 1.16852 |
| Decile 3 | 1.05436 |
| Decile 2 | 0.929948 |
| Decile 1 | 0.764616 |
| Minimum | 0 |
|
|
- Mean = 1.38469
- Std.dev = 0.62503
- 962 items above graph maximum of 3.37461
|
Instance 1 : On-line cycle 1, February 2011 to April 2011.
100,519 participants, 100,519 items
| Maximum | 13.5216 |
| Decile 9 | 2.07333 |
| Decile 8 | 1.74543 |
| Decile 7 | 1.56127 |
| Decile 6 | 1.42134 |
| Median | 1.30431 |
| Decile 4 | 1.19324 |
| Decile 3 | 1.08238 |
| Decile 2 | 0.96063 |
| Decile 1 | 0.807727 |
| Minimum | 0 |
|

|
- Mean = 1.40441
- Std.dev = 0.609058
- 1531 items above graph maximum of 3.33893
|
Instance 2 : On-line cycle 2, June 2011 to September 2011.
83,201 participants, 83,201 items
| Maximum | 13.4823 |
| Decile 9 | 2.05106 |
| Decile 8 | 1.72966 |
| Decile 7 | 1.54765 |
| Decile 6 | 1.40904 |
| Median | 1.29197 |
| Decile 4 | 1.1829 |
| Decile 3 | 1.07173 |
| Decile 2 | 0.952572 |
| Decile 1 | 0.795566 |
| Minimum | 0 |
|

|
- Mean = 1.39127
- Std.dev = 0.609388
- 1284 items above graph maximum of 3.30655
|
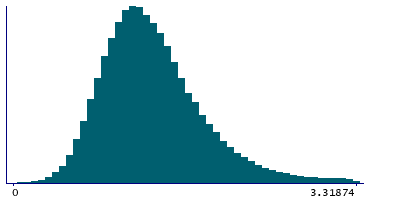
Instance 3 : On-line cycle 3, October 2011 to December 2011.
103,700 participants, 103,700 items
| Maximum | 12.5201 |
| Decile 9 | 2.05751 |
| Decile 8 | 1.73672 |
| Decile 7 | 1.54793 |
| Decile 6 | 1.40908 |
| Median | 1.28965 |
| Decile 4 | 1.18 |
| Decile 3 | 1.07077 |
| Decile 2 | 0.950307 |
| Decile 1 | 0.796292 |
| Minimum | 0 |
|
|
- Mean = 1.39301
- Std.dev = 0.608702
- 1649 items above graph maximum of 3.31874
|
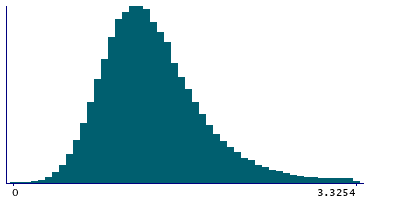
Instance 4 : On-line cycle 4, April 2012 to June 2012.
100,169 participants, 100,169 items
| Maximum | 15.9568 |
| Decile 9 | 2.06341 |
| Decile 8 | 1.74039 |
| Decile 7 | 1.55213 |
| Decile 6 | 1.41582 |
| Median | 1.29622 |
| Decile 4 | 1.1868 |
| Decile 3 | 1.07645 |
| Decile 2 | 0.956976 |
| Decile 1 | 0.801419 |
| Minimum | 0 |
|
|
- Mean = 1.39789
- Std.dev = 0.609893
- 1566 items above graph maximum of 3.3254
|
