Data
458,244 items of data are available, covering 210,856 participants.
Defined-instances run from 0 to 4, labelled using Instancing
1.
Units of measurement are ug.
| Maximum | 360.904 |
| Decile 9 | 65.9539 |
| Decile 8 | 55.0651 |
| Decile 7 | 48.6809 |
| Decile 6 | 43.9242 |
| Median | 39.8905 |
| Decile 4 | 36.19 |
| Decile 3 | 32.5535 |
| Decile 2 | 28.6107 |
| Decile 1 | 23.6526 |
| Minimum | 0 |
|

|
- Mean = 43.3315
- Std.dev = 19.7218
- 5796 items above graph maximum of 108.255
|
5 Instances
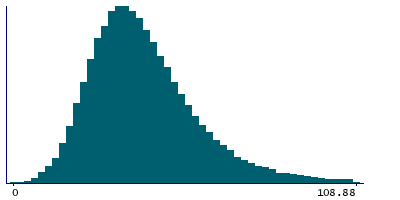
Instance 0 : Conducted in assessment centre, April 2009 to September 2010.
70,655 participants, 70,655 items
| Maximum | 327.99 |
| Decile 9 | 65.6314 |
| Decile 8 | 54.5173 |
| Decile 7 | 48.0389 |
| Decile 6 | 43.1417 |
| Median | 39.0359 |
| Decile 4 | 35.2645 |
| Decile 3 | 31.576 |
| Decile 2 | 27.4984 |
| Decile 1 | 22.3823 |
| Minimum | 0 |
|
|
- Mean = 42.5961
- Std.dev = 20.3547
- 890 items above graph maximum of 108.88
|
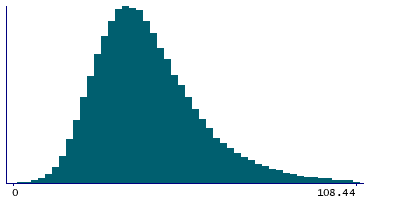
Instance 1 : On-line cycle 1, February 2011 to April 2011.
100,519 participants, 100,519 items
| Maximum | 291.909 |
| Decile 9 | 66.2389 |
| Decile 8 | 55.4586 |
| Decile 7 | 49.1529 |
| Decile 6 | 44.3482 |
| Median | 40.3504 |
| Decile 4 | 36.6694 |
| Decile 3 | 33.0306 |
| Decile 2 | 29.0563 |
| Decile 1 | 24.0374 |
| Minimum | 0 |
|
|
- Mean = 43.6817
- Std.dev = 19.3714
- 1166 items above graph maximum of 108.44
|
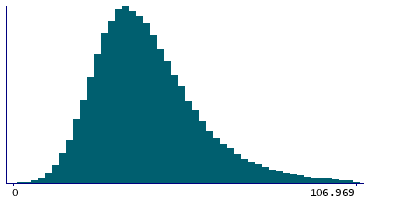
Instance 2 : On-line cycle 2, June 2011 to September 2011.
83,201 participants, 83,201 items
| Maximum | 360.904 |
| Decile 9 | 65.302 |
| Decile 8 | 54.6012 |
| Decile 7 | 48.3687 |
| Decile 6 | 43.6492 |
| Median | 39.6555 |
| Decile 4 | 35.9862 |
| Decile 3 | 32.4164 |
| Decile 2 | 28.5339 |
| Decile 1 | 23.6346 |
| Minimum | 0 |
|
|
- Mean = 43.0799
- Std.dev = 19.6177
- 1116 items above graph maximum of 106.969
|
Instance 3 : On-line cycle 3, October 2011 to December 2011.
103,700 participants, 103,700 items
| Maximum | 272.143 |
| Decile 9 | 65.934 |
| Decile 8 | 55.0282 |
| Decile 7 | 48.5789 |
| Decile 6 | 43.819 |
| Median | 39.7667 |
| Decile 4 | 36.1114 |
| Decile 3 | 32.4979 |
| Decile 2 | 28.6034 |
| Decile 1 | 23.7331 |
| Minimum | 0 |
|

|
- Mean = 43.2987
- Std.dev = 19.6553
- 1356 items above graph maximum of 108.135
|
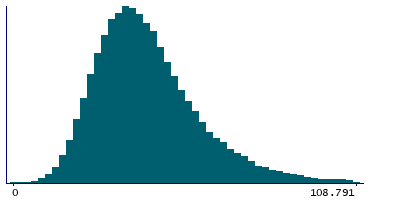
Instance 4 : On-line cycle 4, April 2012 to June 2012.
100,169 participants, 100,169 items
| Maximum | 303.351 |
| Decile 9 | 66.4219 |
| Decile 8 | 55.4182 |
| Decile 7 | 49.0197 |
| Decile 6 | 44.3202 |
| Median | 40.3247 |
| Decile 4 | 36.6059 |
| Decile 3 | 32.9509 |
| Decile 2 | 29.0136 |
| Decile 1 | 24.0524 |
| Minimum | 0 |
|
|
- Mean = 43.7415
- Std.dev = 19.7531
- 1279 items above graph maximum of 108.791
|
