Data
458,244 items of data are available, covering 210,856 participants.
Defined-instances run from 0 to 4, labelled using Instancing
1.
Units of measurement are ug.
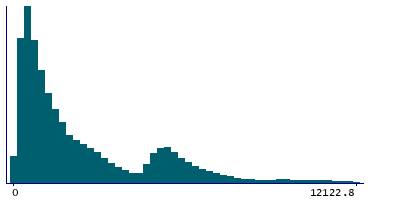
| Maximum | 48752.6 |
| Decile 9 | 6230.04 |
| Decile 8 | 5042.07 |
| Decile 7 | 3029.07 |
| Decile 6 | 2077.15 |
| Median | 1464.51 |
| Decile 4 | 1056.93 |
| Decile 3 | 761.438 |
| Decile 2 | 529.836 |
| Decile 1 | 337.238 |
| Minimum | 0 |
|
|
- Mean = 2624.62
- Std.dev = 2854
- 5558 items above graph maximum of 12122.8
|
5 Instances
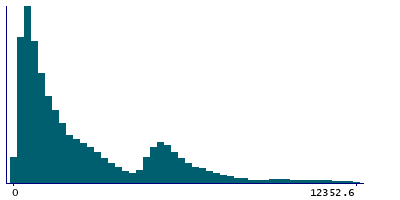
Instance 0 : Conducted in assessment centre, April 2009 to September 2010.
70,655 participants, 70,655 items
| Maximum | 43971.4 |
| Decile 9 | 6478.72 |
| Decile 8 | 5163.76 |
| Decile 7 | 3123.32 |
| Decile 6 | 2094.94 |
| Median | 1411.83 |
| Decile 4 | 996.977 |
| Decile 3 | 698.547 |
| Decile 2 | 474.045 |
| Decile 1 | 299.273 |
| Minimum | 0 |
|
|
- Mean = 2681.29
- Std.dev = 3005.44
- 871 items above graph maximum of 12658.2
|
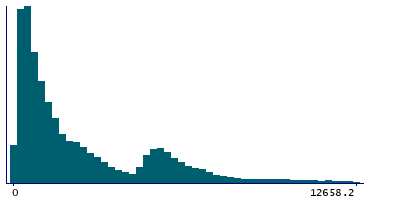
Instance 1 : On-line cycle 1, February 2011 to April 2011.
100,519 participants, 100,519 items
| Maximum | 48752.6 |
| Decile 9 | 6349.31 |
| Decile 8 | 5177.41 |
| Decile 7 | 3260.1 |
| Decile 6 | 2225.38 |
| Median | 1548.88 |
| Decile 4 | 1102.56 |
| Decile 3 | 786.393 |
| Decile 2 | 544.976 |
| Decile 1 | 346.008 |
| Minimum | 0 |
|
|
- Mean = 2732.33
- Std.dev = 2934.7
- 1215 items above graph maximum of 12352.6
|
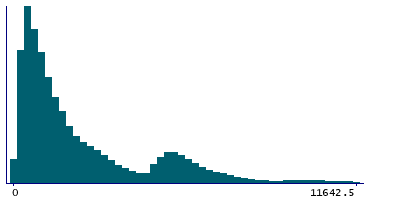
Instance 2 : On-line cycle 2, June 2011 to September 2011.
83,201 participants, 83,201 items
| Maximum | 44693.9 |
| Decile 9 | 5997.31 |
| Decile 8 | 4680.14 |
| Decile 7 | 2725.12 |
| Decile 6 | 1892.22 |
| Median | 1395.84 |
| Decile 4 | 1044.03 |
| Decile 3 | 776.731 |
| Decile 2 | 549.131 |
| Decile 1 | 352.157 |
| Minimum | 0 |
|
|
- Mean = 2462.62
- Std.dev = 2678.23
- 975 items above graph maximum of 11642.5
|
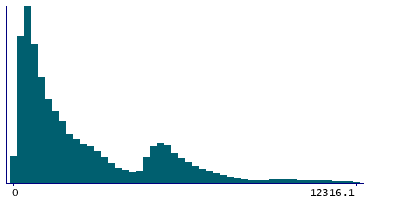
Instance 3 : On-line cycle 3, October 2011 to December 2011.
103,700 participants, 103,700 items
| Maximum | 45521.6 |
| Decile 9 | 6328.78 |
| Decile 8 | 5157.02 |
| Decile 7 | 3260.27 |
| Decile 6 | 2233.94 |
| Median | 1567.81 |
| Decile 4 | 1106.35 |
| Decile 3 | 779.959 |
| Decile 2 | 538.125 |
| Decile 1 | 341.434 |
| Minimum | 0 |
|
|
- Mean = 2722.66
- Std.dev = 2887.82
- 1249 items above graph maximum of 12316.1
|
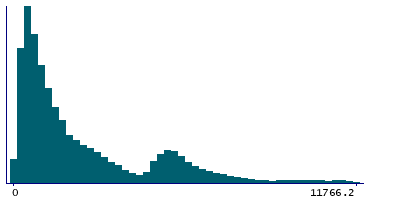
Instance 4 : On-line cycle 4, April 2012 to June 2012.
100,169 participants, 100,169 items
| Maximum | 48675.6 |
| Decile 9 | 6054.44 |
| Decile 8 | 4854.04 |
| Decile 7 | 2827.77 |
| Decile 6 | 1932.13 |
| Median | 1387.5 |
| Decile 4 | 1020.39 |
| Decile 3 | 748.299 |
| Decile 2 | 531.379 |
| Decile 1 | 342.644 |
| Minimum | 0 |
|
|
- Mean = 2509.63
- Std.dev = 2756.52
- 1163 items above graph maximum of 11766.2
|
